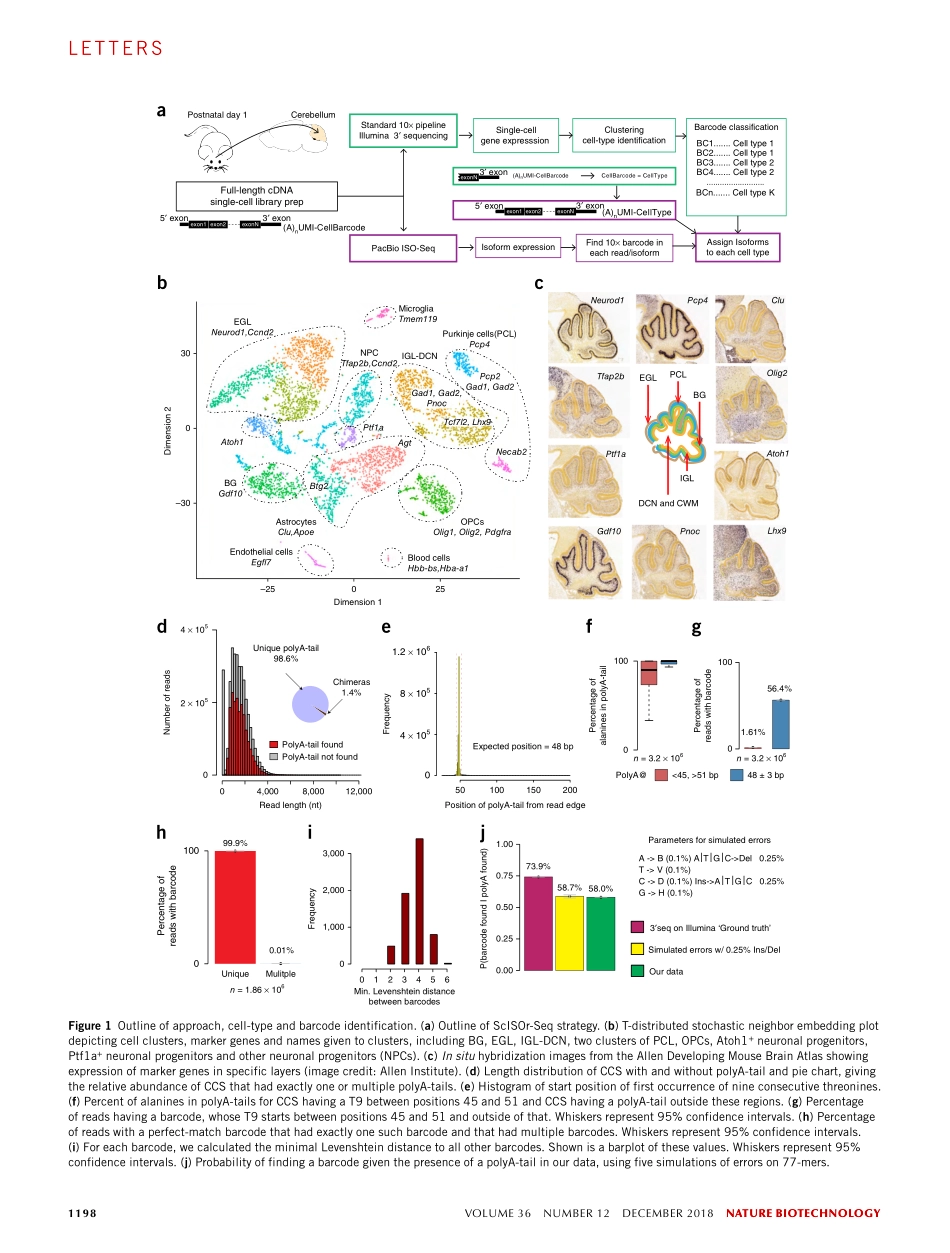
分享
Gupta-2018-Single-cell isoform RNA sequencing.pdf
下载文档

ID:3519235

大小:1.34MB

页数:12页

格式:PDF

时间:2024-05-18

收藏 分享赚钱
温馨提示:
1. 部分包含数学公式或PPT动画的文件,查看预览时可能会显示错乱或异常,文件下载后无此问题,请放心下载。
2. 本文档由用户上传,版权归属用户,汇文网负责整理代发布。如果您对本文档版权有争议请及时联系客服。
3. 下载前请仔细阅读文档内容,确认文档内容符合您的需求后进行下载,若出现内容与标题不符可向本站投诉处理。
4. 下载文档时可能由于网络波动等原因无法下载或下载错误,付费完成后未能成功下载的用户请联系客服处理。
网站客服:3074922707
Gupta-2018-Single-cell isoform RNA sequencing Gupta 2018 Single cell
nature biotechnology VOLUME 36 NUMBER 12 DECEMBER 2018 1197lettersFull-length RNA sequencing(RNA-Seq)has been applied to bulk tissue,cell lines and sorted cells to characterize transcriptomes111,but applying this technology to single cells has proven to be difficult,with less than ten single-cell transcriptomes having been analyzed thus far12,13.Although single splicing events have been described for 200 single cells with statistical confidence14,15,full-length mRNA analyses for hundreds of cells have not been reported.Single-cell short-read 3 sequencing enables the identification of cellular subtypes1621,but full-length mRNA isoforms for these cell types cannot be profiled.We developed a method that starts with bulk tissue and identifies single-cell types and their full-length RNA isoforms without fluorescence-activated cell sorting.Using single-cell isoform RNA-Seq(ScISOr-Seq),we identified RNA isoforms in neurons,astrocytes,microglia,and cell subtypes such as Purkinje and Granule cells,and cell-type-specific combination patterns of distant splice sites69,22,23.We used ScISOr-Seq to improve genome annotation in mouse Gencode version 10 by determining the cell-type-specific expression of 18,173 known and 16,872 novel isoforms.Unlike sorting-based methods(Supplementary Fig.1a),ScISOr-Seq identifies isoforms in 1,000 single cells from bulk tissue without cell sorting by combining two technologies(Fig.1a).We used microfluid-ics to amplify full-length cDNA from single cells in a sample.cDNA produced from each single cell was barcoded to enable cell-of-origin identification and then split into two pools,with one pool being used for short-read Illumina 3 sequencing to measure gene expression and the other pool being used for long-read sequencing and isoform identification.Short-read 3 sequencing provided molecular counts for each gene and cell,which enabled clustering of cells and cell type assignment using cell-type-specific markers.Long-read sequencing with Pacific Biosciences(PacBio)1,2,4,5 or Oxford Nanopore3 was used to identify full-length RNA isoforms.Single-cell barcodes were also present in long reads and could be used to determine the individual cell of origin for each long read.Given that most single cells are assigned to a named cluster,we were also able to assign the cluster name,for example,Purkinje cell or astrocyte,to each long read (Fig.1a and Online Methods).We used ScISOr-Seq to identify cell-type-specific isoforms in mouse cerebellum at postnatal day 1(P1).We sequenced a mean of 17,885 reads per cell(according to 10 xGenomics summary statistics).After filtering cells(Online Methods)to retain reads confidently mapped to genes,we had 3,875 unique molecular identifiers(UMIs)and 1,448 genes per cell(Supplementary Fig.2ad).We used these short reads to cluster 6,627 cells into 17 groups(Fig.1b,Supplementary Fig.2d,Online Methods and Supplementary Code).High expression of well-established cell-type-specific markers identified many clusters as cell types.High expression of Pdgfra,Olig1 and Olig2 identified a cluster of oligodendrocyte precursors(OPCs;Fig.1b,c).Clu and Apoe identified two clusters of astrocytes and Gdf10(refs.24,25)identified a cluster of Bergmann glia(BG).We also identified three large clusters of neuronal subtypes:the external granular layer(EGL)cell cluster,marked by expression of Neurod1 and Ccdn2,contained cells in several stages of differentiation;Purkinje cells,marked by expression of Pcp4,Gad1 and Gad2 in the Purkinje cell layer(PCL);and other neurons known to be present in the deep cerebellar nuclei(DCN)cluster close to internal granular layer(IGL)neurons.Together,DCN and IGL neurons expressed Pnoc,Snhg11,Tcf7l2,Gad1,Gad2 and Lhx9.The proximity of DCN and IGL neurons in clustering probably reflects their overlapping embryonic origins.Given this proximity of DCN and IGL,and the smaller number of long reads for both clusters when separated,we grouped these clusters and collectively refer to these two populations as IGL-DCN(Fig.1b).This should not be interpreted as DCN and IGL being identical.These cell-type-specific expression patterns exhibited specific anatomical localization in the developing cerebellum(Fig.1c)26.Three additional clusters,each representing between 25%of all cells,expressed genes associated with neural pro-genitor cells,including Ccnd2(which is highly expressed in the post-natal EGL),Atoh1(glutamatergic neuron precursors from the rhombic single-cell isoform rNA sequencing characterizes isoforms in thousands of cerebellar cellsIshaan Gupta1,9,Paul G Collier1,9,Bettina Haase2,Ahmed Mahfouz1,3,4,Anoushka Joglekar1,Taylor Floyd1,Frank Koopmans5,Ben Barres6,8,August B Smit5,Steven A Sloan6,Wenjie Luo7,Olivier Fedrigo2,M Elizabeth Ross1&Hagen U Tilgner11Brain and Mind Research Institute and Center for Neurogenetics,Weill Cornell Medicine,New York,New York,USA.2The Rockefeller University,New York,New York,USA.3Leiden Computational Biology Center,Leiden University Medical Center,Leiden,the Netherlands.4Delft Bioinformatics Lab,Delft University of Technology,Delft,the Netherlands.5Department of Molecular and Cellular Neurobiology,Center for Neurogenomics and Cognitive Research,Amsterdam Neuroscience,VU University,Amsterdam,the Netherlands.6Department of Neurobiology,Stanford University,Stanford,California,USA.7Brain and Mind Research Institute and Appel Alzheimers Research Institute,Weill Cornell Medicine,New York,New York,USA.8Deceased.9These authors contributed equally to this work.Correspondence should be addressed to H.U.T.(hut2006med.cornell.edu).Received 2 January;accepted 20 August;published online 15 October 2018;doi:10.1038/nbt.42591198VOLUME 36 NUMBER 12 DECEMBER 2018 nature biotechnologyletters2502530030Dimension 1Dimension 2Neurod1Pcp4PnocPtf1aOlig2Lhx9bcCerebellumFull-length cDNAsingle-cell library prepPacBio ISO-SeqStandard 10 pipelineIllumina 3 sequencingBC1.Cell type 1BC2.Cell type 1BC3.Cell type 2BC4.Cell type 2.BCn.Cell type KSingle-cellgene expresssion Clusteringcell-type identificationIsoform expressionFind 10 barcode ineach read/isoformAssign Isoformsto each cell typeBarcode classificationaAtoh1Tfap2bCluPostnatal day 1(A)nUMI-CellBarcodeexon1 exon2exonN5 exon3 exon(A)nUMI-CellBarcodeexonN3 exon(A)nUMI-CellTypeexon1 exon2exonN5 exon3 exonCellBarcode=CellTypeRead length(nt)Number of readsPolyA-tail foundPolyA-tail not foundPosition of polyA-tail from read edgeExpected position=48 bpChimeras1.4%Unique polyA-tail98.6%Percentage ofreads with barcodeUniqueMulitplePercentage ofreads with barcode99.9%0.01%Percentage ofalanines in polyA-tailMin.Levenshtein distancebetween barcodesFrequency012345601,0002,0003,000P(barcode found I polyA found)3seq on Illumina Ground truthSimulated errors w/0.25%Ins/DelOur dataA-B(0.1%)ATGC-Del 0.25%T-V(0.1%)C-D(0.1%)Ins-ATGC 0.25%G-H(0.1%)Parameters for simulated errorsdefghij51 bp48 3 bpPolyAMicrogliaTmem119Purkinje cells(PCL)Pcp4EGLNeurod1,Ccnd2OPCsOlig1,Olig2,PdgfraBlood cellsHbb-bs,Hba-a1AstrocytesClu,ApoeEndothelial cellsEgfl7IGL-DCNBtg2Pcp2Gad1,Gad2Necab2 Atoh1AgtGad1,Gad2,PnocTcf7l2,Lhx9NPCTfap2b,Ccnd2Ptf1aPCLEGLIGLDCN and CWMBGGdf10BGGdf10n=3.2 106n=3.2 106n=1.86 10604,0008,00012,00004 1052 105Frequency5010015020004 1058 1051.2 106010001001.61%56.4%0.000.250.500.751.0073.9%58.7%58.0%0100Figure 1 Outline of approach,cell-type and barcode identification.(a)Outline of ScISOr-Seq strategy.(b)T-distributed stochastic neighbor embedding plot depicting cell clusters,marker genes and names given to clusters,including BG,EGL,IGL-DCN,two clusters of PCL,OPCs,Atoh1+neuronal progenitors,Ptf1a+neuronal progenitors and other neuronal progenitors(NPCs).(c)In situ hybridization images from the Allen Developing Mouse Brain Atlas showing expression of marker genes in specific layers(image credit:Allen Institute).(d)Length distribution of CCS with and without polyA-tail and pie chart,giving the relative abundance of CCS that had exactly one or multiple polyA-tails.(e)Histogram of start position of first occurrence of nine consecutive threonines.(f)Percent of alanines in polyA-tails for CCS having a T9 between positions 45 and 51 and CCS having a polyA-tail outside these regions.(g)Percentage of reads having a barcode,whose T9 starts between positions 45 and 51 and outside of that.Whiskers represent 95%confidence intervals.(h)Percentage of reads with a perfect-match barcode that had exactly one such barcode and that had multiple barcodes.Whiskers represent 95%confidence intervals.(i)For each barcode,we calculated the minimal Levenshtein distance to all other barcodes.Shown is a barplot of these values.Whiskers represent 95%confidence intervals.(j)Probability of finding a barcode given the presence of a polyA-tail in our data,using five simulations of errors on 77-mers.nature biotechnology VOLUME 36 NUMBER 12 DECEMBER 2018 1199letterslip and EGL)or Ptf1a(GABAergic neuron precursors from the ventricular zone)(Fig.1b and Supplementary Fig.1b).We identified other cell populations:microglia,marked by myeloid-associated genes(for example,C1qa,C1qb,C1qc and Tmem119),and endothelial and circulatory-system cells.Our clustering recapitulates a large propor-tion of cell types classically observed in P1 cerebellum27.EGL,IGL-DCN cells and astrocytic cells were the largest clusters and blood cells were the smallest(Supplementary Fig.2e).Detected reads,short-read UMIs and genes per cell revealed slight differences between cell types,but were of similar orders of magnitude.Consistent with their eventual complexity and maturing extensive arborization,Purkinje cells had the highest number of read,UMI and gene counts,whereas blood cells had the lowest gene count(Supplementary Fig.2fh).Sequencing of a second independent replicate(rep2)and within-replicate analyses revealed that all clusters were dissimilar to any other clusters in the same replicate(Jaccard index 0.34 for all clus-ter pairs;Supplementary Fig.3a,b).To assess cluster stability,we increased Illumina sequencing depth threefold in rep2.In all of the clusters,95100%of cells were attributed to the same cluster with threefold deeper sequencing compared with the original sequenc-ing depth.Comparison of marker genes between clusters in the two replicates using the Jaccard index identified highly similar clusters(Supplementary Fig.3c)with one exception.The smallest cluster(blood cells)in replicate 1(rep1)was missing from rep2.Cell-type abundance was reproducible between replicates and was highly correlated(Pearson correlation=0.91,n=11,correlation-test P value=4.5 105;Supplementary Fig.3d).Next,we generated 5.2 million PacBio circular consensus reads(CCS,PB_rep1;Online Methods).Cellular barcodes are located close to the polyA-tail,so we first searched for polyA-tails.We located the first nine consecutive Ts(T9)in the first 200 bp of each read and its reverse complement.61.6%of CCS contained a T9,broadly consist-ent with our previous estimation(67%)1,4.Reads with and without T9 had similar lengths,apart from CCS 200 bp accumulating in non-T9 CCS.1.4%of T9-CCS had a T9 in the read start and the complements start.These may include chimeras introduced during reverse transcrip-tion,PCR or blunt-end PacBio library preparation(Fig.1d).Error-free sequencing of the theoretical construct(21-bp adaptor sequence,16-bp cellular barcode,and 10-bp UMI and polyA-tail)yielded a T9 starting at position 48.97%of T9-CCS had a T9 starting between positions 45 and 51(expected-T9-position CCS;Fig.1e).These CCS have almost 100%T-content in a 30-bp window(polydT-primers were 30 nt long)starting at the T9.Non-expected T9-position CCS had lower T-content(Fig.1f).We then searched for perfectly matched 16-mer cellular barcodes between the read start and the polyA-tail(the barcode search region).Expected T9-position CCS showed a higher barcode identification rate than CSS with a T9 in other positions,and 97.2%of CCS with identified barcodes were among the expected T9-position CCS(Fig.1g).For CCS with a perfectly matching 16-mer cellular barcode,98.8%had exactly one such barcode,and no other barcode had one mismatch with the barcode search region(Fig.1h).In total,for 58.0%(compared with 74.0%for 10 x-3seq)of the polyA-tail-containing CCS,we identified a perfect-match 16-mer cellular barcode to the single cell in which the RNA isoform was transcribed.For all 6,627 barcodes,the minimal editing distance to any other barcode was calculated.For 92.7%of barcodes,this minimal(Levenshtein)dis-tance was 3 or greater,and for the remaining barcodes it was 2.Thus,for most barcodes there was only one specific error pattern(three errors)that would result in a mis-identified cell.However,in most cases,three random errors would discard the read because none of the 6,627 known barcodes would be detected(Fig.1i).To confirm this hypothesis,we simulated errors(Online Methods)in 42 million 77-mers consisting of 10 read1 adaptor(21 bases),single-cell barcode(16 bases),UMI(10 bases)and a 30-mer polyT-tail(repre-senting the polyA-tail).We detected a false-positive barcode among the 6,627 barcodes in 100 CCS(Supplementary Fig.4d).Detected short-read and long-read UMIs per single cell were highly correlated(Pearson correlation=0.95,correlation-test P 2.2 1016;Supplementary Fig.4e).Long-read statistics per cell cluster mirrored those for our short-read data sets(Supplementary Figs.2fh and 4fh),with lower long-read numbers.We also tested nanopore long-read sequencing using a MinIon R9.5(Online Methods)and searched for barcodes in 2.3 million Nanopore reads28.We found lower relative numbers of 1D Oxford Nanopore reads with a T9,possibly owing to incorrectly reading homopoly-mers using a minION28.However,31.4%(1D)and 35.2%(passed 1D2 Oxford Nanopore reads)of nanopore reads had a 30-bp win-dow with 25 Ts.Although the variation from the expected position in nanopore reads was larger than for PacBio reads(90 bp versus 3 bp),accumulation around the expected position was observed and exact barcode matches revealed unique barcodes in 6.0%of the passed 1D Oxford Nanopore reads and 32.7%of the passed 1D2 Oxford Nanopore reads;Supplementary Fig.5).Overall,we were able to detect 50,000 cluster-specific long reads per flow cell.With each current flow cell requiring 1 g of cDNA,further PCR(with associ-ated biases)would be needed to carry out large-scale ScISOr-Seq using a minION,whereas only 16 cycles of PCR are needed for 2050 SMRTcells(PacBio),yielding up to 5 million long reads assigned to single cells.Better performance with a minION would be obtained using longer and more diverse barcodes.We aligned PacBio reads to the mouse genome29(version mm10)using STAR30 and carried out mapping quality control as described previously1,4,6(Online Methods,Supplementary Note 1 and Supplementary Fig.6).We analyzed novel isoforms with respect to mouse Gencode version 10,as outlined previously1,6,31(Online Methods)to produce a long-read-enhanced and cell-type-resolved annotation.We consid

此文档下载收益归作者所有

下载文档
收起
展开