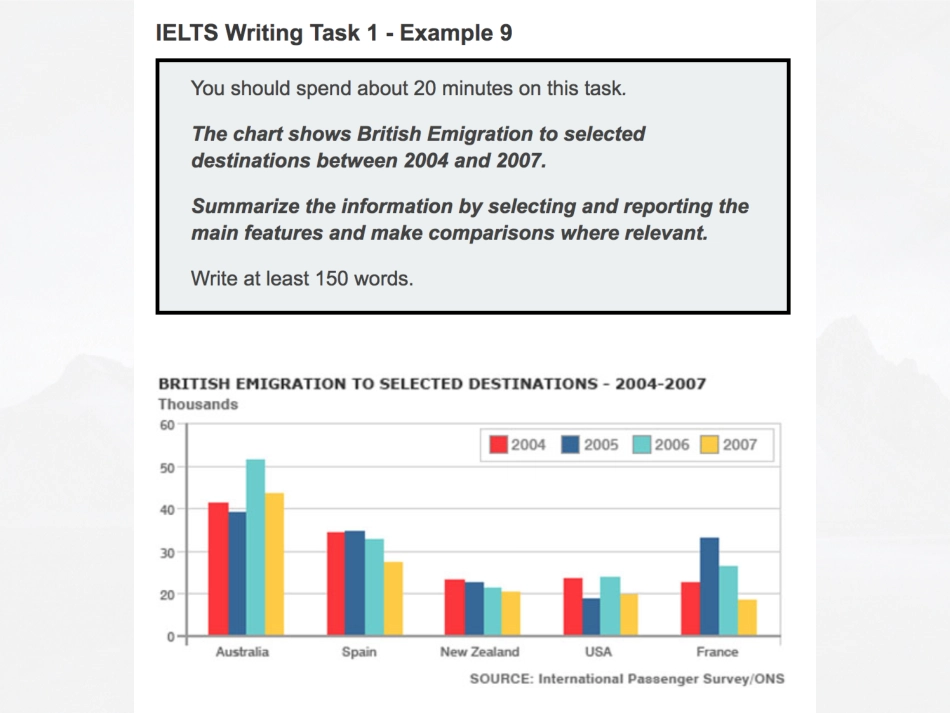
PAPA����Lesson3JackShaw�������ThebarchartshowsthenumberofBritishpeoplewhoemigratedtofivedestinationsovertheperiod2004to2007.Itisevidentfromthechartthatthroughouttheperiod,themostpopularplacetomovetowasAustralia.EmigrationtoAustraliastoodatjustover40,000peoplein2004,whichwasapproximately6,000higherthanforSpain,andtwiceashighastheotherthreecountries.Apartfromajumptoaround52,000in2006,itremainedaroundthislevelthroughouttheperiod.ThenextmostpopularcountryforBritonstomovetowasSpain,thoughitspopularitydeclinedoverthetimeframetofinishatbelow30,000in2007.Despitethis,thefigurewasstillhigherthanfortheremainingthreecountries.Approximately20,000peopleemigratedtoNewZealandeachyear,whiletheUSAfluctuatedbetween20-25,000peopleovertheperiod.AlthoughthenumberofvisitorstoFrancespikedtonearly35,000in2005,itwasthecountrythatwastheleastpopulartoemigratetoattheendoftheperiod,atjustunder20,000people.ThebarchartshowsthechangingpatternsoftransportuseinaEuropeancityduringtheperiodfrom1960to2000.Itisclearthattheuseofthecarasameansoftransportdramaticallyincreasedovertheperiod,whiletheothersfell.Indetail,in1960themotorcarwasusedleastasamethodoftransportwithonlyabout7%ofthepopulationusingthismethodbutcarusegrewsteadilyandstronglytofinallyreachabout37%ofthepopulationby2000.Thiswasamassive5-foldincreaseinuse.Overthissameperiod,however,thepopularityofwalking,whichhadbeenthemostpopularmeansoftransportwith35%ofthepopulationin1960havingitastheirpreferredwayofgettingaround,fellto10%.Bicycleusealsofellfromahighofabout27%in1960tojust7%in2000.Ontheotherhand,bususewasmoreerraticbeingpopularwithalmost20%ofthepopulationin1960andrisingtoapeakofabout27%in1980beforefallingbacktoabout18%in2000.(188Words)TASK1STATICCHARTSBAR/PIE/TABLE1�������2������3������4�������������/������������/���������/�������/�����������������������������������������/������������������������������...