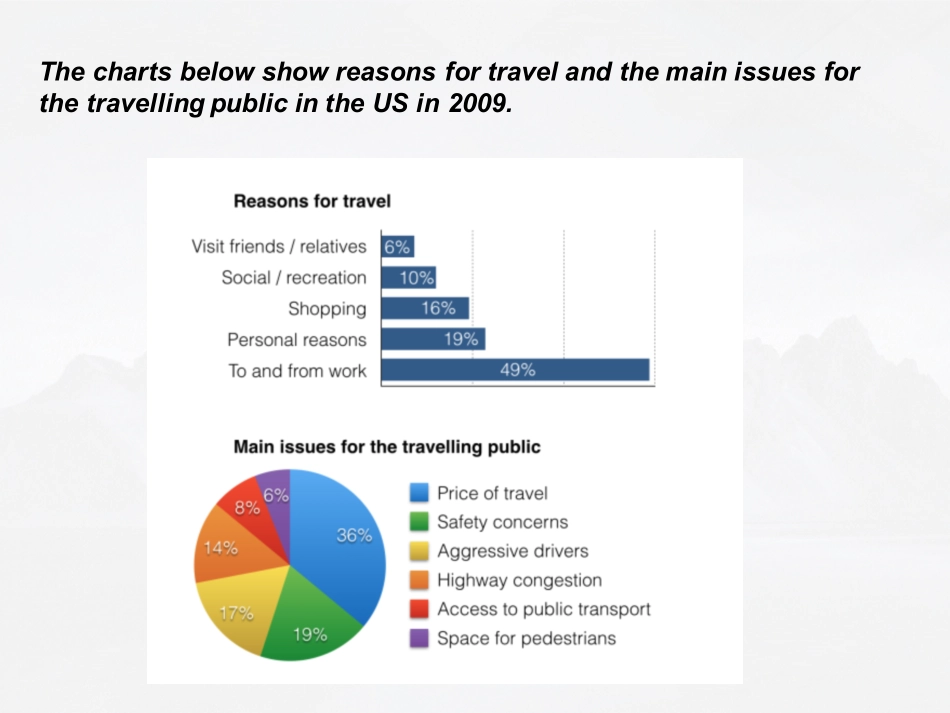
PAPA����Lesson3JackShaw�������ThechartsbelowshowreasonsfortravelandthemainissuesforthetravellingpublicintheUSin2009.ThebarchartandpiechartgiveinformationaboutwhyUSresidentstravelledandwhattravelproblemstheyexperiencedintheyear2009.ItisclearthattheprincipalreasonwhyAmericanstravelledin2009wastocommutetoandfromwork.Inthesameyear,theprimaryconcernofAmericans,withregardtothetripstheymade,wasthecostoftravelling.Lookingmorecloselyatthebarchart,wecanseethat49%ofthetripsmadebyAmericansin2009wereforthepurposeofcommuting.Bycontrast,only6%oftripswerevisitstofriendsorrelatives,andoneintentripswereforsocialorrecreationreasons.Shoppingwascitedasthereasonfor16%ofalltravel,whileunspecific‘personalreasons’accountedfortheremaining19%.Accordingtothepiechart,pricewasthekeyconsiderationfor36%ofAmericantravellers.Almostoneinfivepeoplecitedsafetyastheirforemosttravelconcern,whileaggressivedrivingandhighwaycongestionwerethemainissuesfor17%and14%ofthetravellingpublic.Finally,atotalof14%ofthosesurveyedthoughtthataccesstopublictransportorspaceforpedestrianswerethemostimportanttravelissues.��2Grouping1.Medicine,EngineeringandLaw2.Media,IT,MathsandLanguages3.EconomicsandBusinessItisapparentfromthebarchartthatthosestudentsstudyingtraditionaluniversitysubjects,suchasMedicine,LawandEngineering,spendthegreatestnumberofhours(over20)inthelibrary.Incontrast,studentsfromMediaandITfaculties,aswellasLanguageandMathsdepartments,spendlessthan10hoursaweekinthelibrary.ThosewhostudyBusinessandEconomicsfallbetweenthesetwogroups.grouping1.LecturesandPersonalstudy=45%2.EntertainmentandSportalmostsame=45%3.PaidworkthesmallestAccordingtothepiechart,allstudentsspendalmosthalfoftheiruniversitylives(45%)studyingorattendinglectures.Theyspendalmostaquarteroftheirtimeplayingsportandanotherquarterentertainingthemselves,whichmeanstheyspendasmuchtimeenjoyingfreetimeactivitiesasstudying.Theremainderoftheirtime,10%,isallocatedtoearningmoney.Thetwochartsillustratehowuniversitystudentsspendtheirtime.Thebargra...