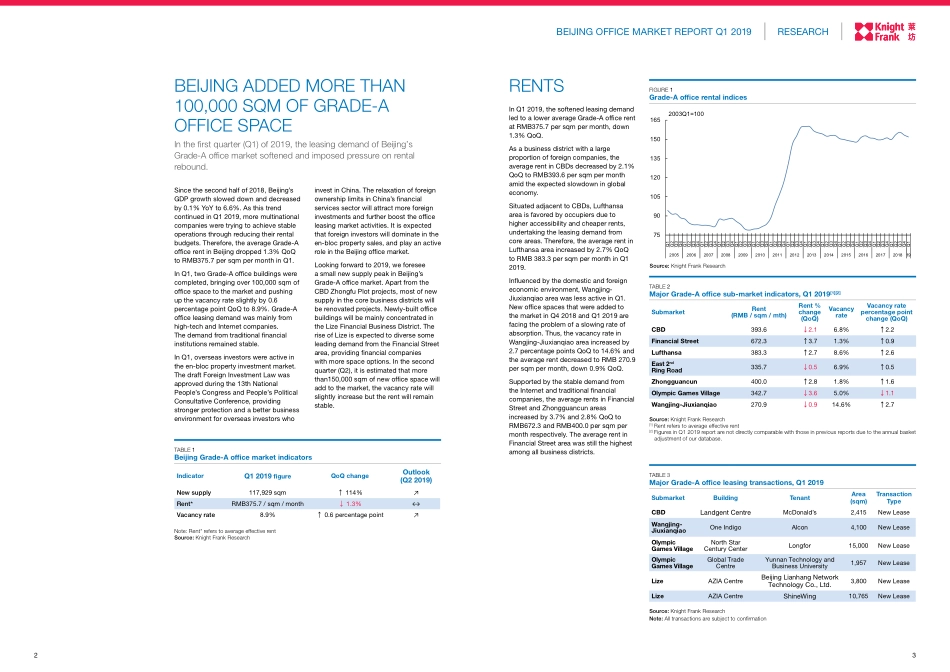
BEIJINGOFFICEMARKETREPORTQ12019北京写字楼市场报告2019年第一季度研究报告32RESEARCHBEIJINGOFFICEMARKETREPORTQ120197590105120135150165Q1Q2Q3Q4Q1Q2Q3Q4Q1Q2Q3Q4Q1Q2Q3Q4Q1Q2Q3Q4Q1Q2Q3Q4Q1Q2Q3Q4Q1Q2Q3Q4Q1Q2Q3Q4Q1Q2Q3Q4Q1Q2Q3Q4Q1Q2Q3Q4Q1Q2Q3Q4Q1Q2Q3Q4Q120052006200720082009201020112012201320142015201620172018192003Q1=100BEIJINGADDEDMORETHAN100,000SQMOFGRADE-AOFFICESPACEInthefirstquarter(Q1)of2019,theleasingdemandofBeijing’sGrade-Aofficemarketsoftenedandimposedpressureonrentalrebound.TABLE2MajorGrade-Aoffcesub-marketindicators,Q12019[1][2]SubmarketRent(RMB/sqm/mth)Rent%change(QoQ)VacancyrateVacancyratepercentagepointchange(QoQ)CBD393.6↓2.16.8%↑2.2FinancialStreet672.3↑3.71.3%↑0.9Lufthansa383.3↑2.78.6%↑2.6East2ndRingRoad335.7↓0.56.9%↑0.5Zhongguancun400.0↑2.81.8%↑1.6OlympicGamesVillage342.7↓3.65.0%↓1.1Wangjing-Jiuxianqiao270.9↓0.914.6%↑2.7Source:KnightFrankResearch[1]Rentreferstoaverageeffectiverent[2]FiguresinQ12019reportarenotdirectlycomparablewiththoseinpreviousreportsduetotheannualbasketadjustmentofourdatabase.FIGURE1Grade-AoffcerentalindicesInQ12019,thesoftenedleasingdemandledtoaloweraverageGrade-AofficerentatRMB375.7persqmpermonth,down1.3%QoQ.Asabusinessdistrictwithalargeproportionofforeigncompanies,theaveragerentinCBDsdecreasedby2.1%QoQtoRMB393.6persqmpermonthamidtheexpectedslowdowninglobaleconomy.SituatedadjacenttoCBDs,Lufthansaareaisfavoredbyoccupiersduetohigheraccessibilityandcheaperrents,undertakingtheleasingdemandfromcoreareas.Therefore,theaveragerentinLufthansaareaincreasedby2.7%QoQtoRMB383.3persqmpermonthinQ12019.Influencedbythedomesticandforeigneconomicenvironment,Wangjing-JiuxianqiaoareawaslessactiveinQ1.NewofficespacesthatwereaddedtothemarketinQ42018andQ12019arefacingtheproblemofaslowingrateofabsorption.Thus,thevacancyrateinWangjing-Jiuxianqiaoareaincreasedby2.7percentagepointsQoQto14.6%andtheaveragerentdecreasedtoRMB270.9persqmpermonth,down0.9%QoQ.SupportedbythestabledemandfromtheInternetandtraditionalfinancialcompanies,theaveragerentsinFinanc...