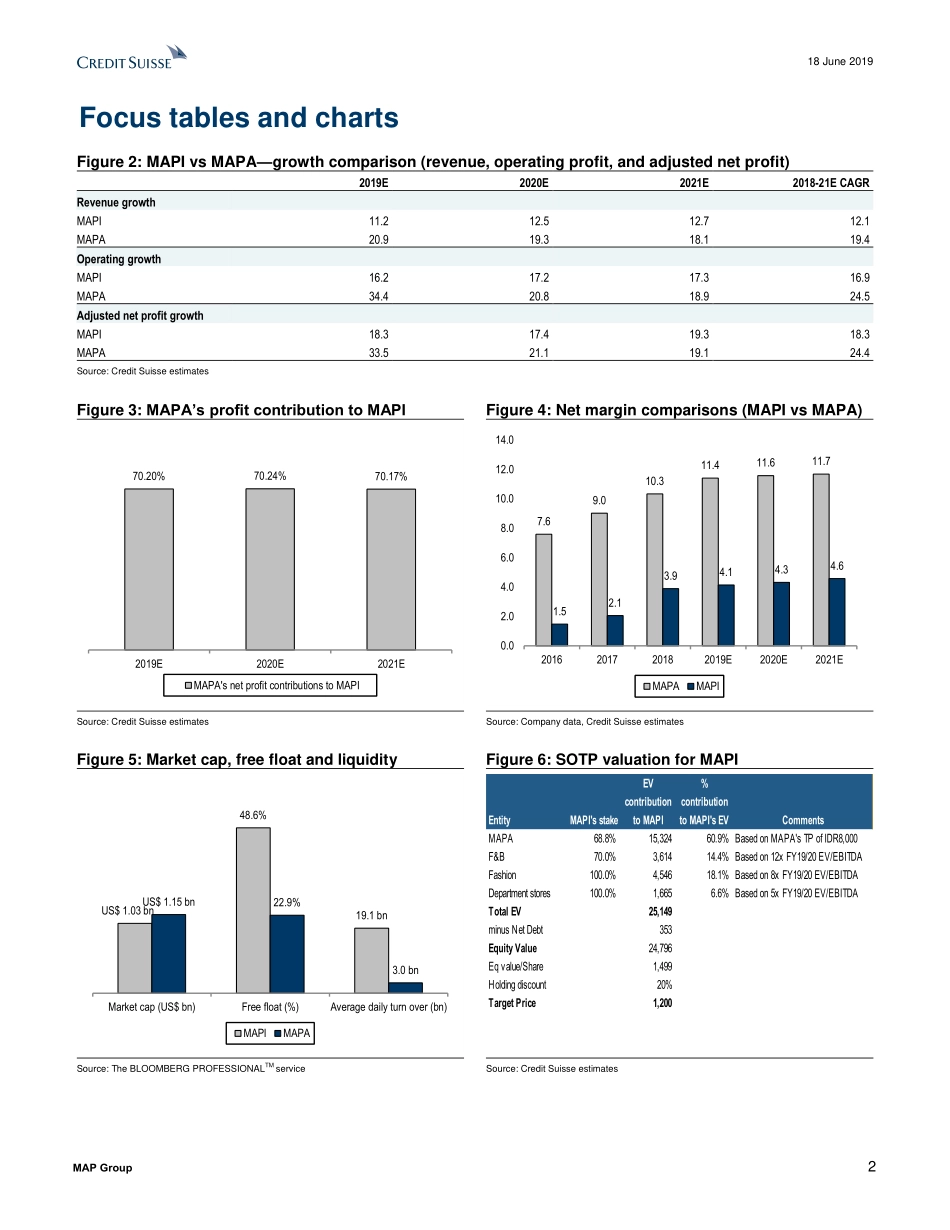
分享
瑞信-亚太地区-零售业-如何在MAPI和MAPA之间做出选择?-2019.6.18-87页 (2).pdf
下载文档

ID:3058936

大小:4.03MB

页数:89页

格式:PDF

时间:2024-01-19

收藏 分享赚钱
温馨提示:
1. 部分包含数学公式或PPT动画的文件,查看预览时可能会显示错乱或异常,文件下载后无此问题,请放心下载。
2. 本文档由用户上传,版权归属用户,汇文网负责整理代发布。如果您对本文档版权有争议请及时联系客服。
3. 下载前请仔细阅读文档内容,确认文档内容符合您的需求后进行下载,若出现内容与标题不符可向本站投诉处理。
4. 下载文档时可能由于网络波动等原因无法下载或下载错误,付费完成后未能成功下载的用户请联系客服处理。
网站客服:3074922707
瑞信-亚太地区-零售业-如何在MAPI和MAPA之间做出选择?-2019.6.18-87页 2 亚太地区 零售业 如何 MAPI MAPA 之间 做出 选择 2019.6 18 87
DISCLOSURE APPENDIX AT THE BACK OF THIS REPORT CONTAINS IMPORTANT DISCLOSURES,ANALYST CERTIFICATIONS,LEGAL ENTITY DISCLOSURE AND THE STATUS OF NON-US ANALYSTS.US Disclosure:Credit Suisse does and seeks to do business with companies covered in its research reports.As a result,investors should be aware that the Firm may have a conflict of interest that could affect the objectivity of this report.Investors should consider this report as only a single factor in making their investment decision.18 June 2019 Asia Pacific/Indonesia Equity Research Retailing MAP Group Research Analysts Deidy Wijaya,CFA 62 21 255 37902 deidy.wijayacredit- Mega Bong 62 21 255 37977 mega.bongcredit- INITIATION How to decide between MAPI and MAPA?Figure 1:CS proprietary scoring for MAPIs major divisions Source:Credit Suisse estimates Assuming coverage on MAPI and initiating coverage on MAPA.Following the placement of MAPAs shares(22.8%)to the public in April 2019,investors now have the option to choose between MAPI/MAPA.We deep-dived into MAPIs major divisions to better understand the strengths and weaknesses of each.We conclude that Active(MAPA)and F&B(MAPB)are MAPIs best divisions.MAPA currently faces benign competition and is the most profitable division.F&B has the highest growth potential and the lowest working capital requirement,but is currently faced with new competition.Fashion has long-term potential in smaller cities and Indochina(Vietnam,Laos,Cambodia),but is less profitable than Active,given a lower gross margin and higher capex requirement.Department Store is overall the weakest division in the group.How do we value MAPI and MAPA?We value MAPA based on DCF and derive a TP of Rp8,000(WACC:12.4%and terminal growth:6%).We value MAPI based on SOTPits Active division is valued based on our TP for MAPA;Fashion is valued at 8x EV/EBITDA;F&B is valued at 12x EV/EBITDA;and Department Store is valued at 5x EV/EBITDA.We treat MAPIs other businesses as part of the holding discount.We use a holding discount of 20%which is lower than INDFs holding discount(30%),as we believe MAPIs F&B business(currently not directly investible)is a more attractive business than INDFs Bogasari business(unlisted).Stock calls:We rate both MAPI(TP Rp1,200;36%implied upside)and MAPA(TP Rp8,000;40%implied upside)OUTPERFORM.The key debates for investors in deciding between the two lie in(1)growth outlook,(2)MAPIs valuation discount,and(3)liquidity of the stocks.We forecast higher growth for MAPA over the next two years,but if liquidity and diversification are the key concerns,MAPI is at present a better option.MAPA is currently trading at 17.6x FY20 blended P/E,while MAPI is trading at 15.6x(11%discount).18 June 2019 MAP Group 2 Focus tables and charts Figure 2:MAPI vs MAPAgrowth comparison(revenue,operating profit,and adjusted net profit)2019E 2020E 2021E 2018-21E CAGR Revenue growth MAPI 11.2 12.5 12.7 12.1 MAPA 20.9 19.3 18.1 19.4 Operating growth MAPI 16.2 17.2 17.3 16.9 MAPA 34.4 20.8 18.9 24.5 Adjusted net profit growth MAPI 18.3 17.4 19.3 18.3 MAPA 33.5 21.1 19.1 24.4 Source:Credit Suisse estimates Figure 3:MAPAs profit contribution to MAPI Figure 4:Net margin comparisons(MAPI vs MAPA)Source:Credit Suisse estimates Source:Company data,Credit Suisse estimates Figure 5:Market cap,free float and liquidity Figure 6:SOTP valuation for MAPI Source:The BLOOMBERG PROFESSIONALTM service Source:Credit Suisse estimates 70.20%70.24%70.17%2019E2020E2021EMAPAs net profit contributions to MAPI7.69.010.311.411.611.71.52.13.94.14.34.60.02.04.06.08.010.012.014.02016201720182019E2020E2021EMAPAMAPIUS$1.03 bn48.6%19.1 bnUS$1.15 bn22.9%3.0 bnMarket cap(US$bn)Free float(%)Average daily turn over(bn)MAPIMAPAEntityMAPIs stakeEV contribution to MAPI%contribution to MAPIs EVCommentsMAPA68.8%15,324 60.9%Based on MAPAs TP of IDR8,000F&B70.0%3,614 14.4%Based on 12x FY19/20 EV/EBITDAFashion100.0%4,546 18.1%Based on 8x FY19/20 EV/EBITDADepartment stores100.0%1,665 6.6%Based on 5x FY19/20 EV/EBITDATotal EV25,149 minus Net Debt353 Equity Value24,796 Eq value/Share1,499 Holding discount20%Target Price1,200 18 June 2019 MAP Group 3 How to decide between MAPI and MAPA?Comparing MAPIs divisions based on our five key criteria for scoring retailers We use our proprietary scoring for Indonesian retailers(link)to evaluate each of MAPIs divisions(Active,Fashion,F&B,and Department Store).Our conclusion is that Active(MAPA)and F&B(MAPB)are MAPIs best divisions.MAPA currently enjoys benign competition and is the most profitable division within MAPI,with the highest EBIT per sq m and the fastest payback period(also helped by lower capex per sq m requirement).F&B has plenty of growth potential outside Greater Jakarta and has the lowest working capital requirement,but its growth and profitability are currently impacted by competition from new coffee players that benefit from the presence of GoFood(Gojeks F&B delivery)and e-wallet/e-money(that are competing with one another through aggressive cashback programmes on many F&B stores).Fashion has a long-term potential in smaller cities and Indochina(Vietnam,Laos,Cambodia)but is less profitable than Active,given a lower gross margin and higher capex requirement.Department store is the least attractive within the group,given consumers preference for specialty stores and online channels.How do we value MAPI and MAPA?Given the lack of a historical valuation band,we value MAPA based on DCF.Our DCF-derived TP implies a valuation multiple of 26.6x/21.9x FY19E/FY20E,which is similar to our target P/E multiple for ACES(26x).We think MAPA should trade at similar valuation to ACES given their similarly dominant positions in their respective segments and solid growth trajectories.We value MAPI based on SOTPthe Active division is valued based on our TP for MAPA;the Fashion division is valued at 8x EV/EBITDA(33%discount to Inditex);the F&B division is valued at 12x EV/EBITDA(30%discount to Starbucks USA);and the Department Store division is valued at 5x EV/EBITDA(slight premium to LPPF).We treat the other small businesses as part of the holding discount.We use a holding discount of 20%,lower than INDFs holding discount(30%)as we believe MAPIs F&B business is more attractive than INDFs Bogasari business(both not investible directly).Choosing between MAPI and MAPA The key debates for investors deciding between MAPI and MAPA lie in three key areas:(1)growth outlook,(2)MAPIs valuation discount,and(3)liquidity of the stocks.We believe MAPA has a stronger growth outlook over the next two years as it produces higher same store sales growth with a solid expansion pipeline.A fair valuation discount for MAPI is a debatable topic,but we think 20%is a fair discount,with the potential of the discount likely to widen when the liquidity of MAPAs stock improves and/or when General Atlantics(GA)sells its stake in MAPB to the public.MAPI is currently far more liquid than MAPA,helped by its bigger free-float.MAPAs liquidity is likely to improve when CVC decides to sell its remaining stake(7.5%)in the company to the public.In conclusion,investors looking to invest in higher growth stock over the next few years should pick MAPA,but if liquidity and diversification are key concerns,MAPI is at present a better option.Key risks Key risks for MAPA:(1)Inability to maintain the very strong growth trajectory;(2)difficulties in finding new locations for expansion;(3)possible market share loss on a high base;(4)agreement with key suppliers(as the Top 5 brands contribute 60%of sales).Key risks for MAPI:(1)High forex risk for fashion division;(2)competition in F&B worsens from here;(3)Department Stores unable to grow;and(4)valuation discount widens when MAPAs liquidity improves or when MAPB becomes investible(GA divesting its stake).Based on our scoring,Active and F&B are MAPIs best divisions,while Department Store is the least attractive We value MAPA using DCF.We use SOTP to value MAPI and apply a 20%holding discount MAPA has a stronger growth outlook over the next few years,while MAPI is more liquid and provides diversification Key risks:MAPAslower growth and market share losses given high base.MAPIvaluation discount could widen when F&B becomes investible 18 June 2019 MAP Group 4 Key valuation comps Figure 7:Indonesia retailers peer comparison Company name Ticker Rating CP(Rp)TP(Rp)Upside(%)Market cap(Rp tn)P/E(x)EV/EBITDA(x)ROE(%)EPS(Rp)Div.yield(%)2019E 2020E 2019E 2020E 2019E 2020E 2019E 2020E 2019E 2020E Sumber Alfaria Trijaya AMRT.JK O 890 1,135 27.5 37.0 36.8 27.0 8.6 7.5 14.4 17.2 24 33 1.1 1.5 ACE hardware Indonesia ACES.JK O 1,760 1,830 4.0 30.2 26.1 21.9 20.3 16.9 23.4 24.0 67 80 1.9 2.3 MAP Active Indonesia MAPA.JK O 5,700 8,000 40.4 16.2 18.9 15.6 11.7 9.4 27.0 27.5 301 366 2.6 3.2 Mitra Adiperkasa MAPI.JK O 880 1,200 36.4 14.6 16.7 14.2 6.1 5.0 19.7 19.4 53 62 1.2 1.4 Ramayana Lestari Sentosa RALS.JK O 1,430 1,875 31.1 10.1 15.2 14.1 11.2 10.2 14.1 14.2 94 101 4.1 4.6 Matahari Department Store LPPF.JK N 3,370 5,390 59.9 9.8 5.6 5.5 3.3 3.0 26.0 23.6 599 618 8.9 9.2 Note:Priced as of 18 June 2019.O=Outperform,N=Neutral.,Source:The BLOOMBERG PROFESSIONALTM service,Credit Suisse estimates Figure 8:Summary of our thesis Ticker Summary of thesis Where we differ vs consensus MAPA MAPA is the most profitable division within MAPI,with the highest EBIT/sq m and the fastest payback period.For the next two years,we forecast MAPA to book the strongest growth among MAPIs major divisions,driven by strong SSSG(8-10%)and robust expansion.Despite the strong growth outlook,MAPA trades at a significant discount to ACES,at 19.3x/15.8x FY19E/FY20E P/E vs 26.7x/22.4x FY19E/FY20E for ACES.The stock is not widely covered by the street.MAPI We think MAPI is currently undervalued given its strong growth potential and leading positions in key growing segments in Indonesia.Trading at 16.8x/14.3x FY19E/FY20E P/E,MAPI is trading at a similar valuation to RALS,with MAPI a better proxy to Indonesias consumption growth given its leading positions in the Active,F&B and Fashion segments.Our TP of Rp1,200/share is among the highest in the street.Our FY19/FY20/FY21 forecasts are 3.7%/3.4%/16.0%higher than consensus.The big difference in our FY21 forecast vs consensus is due to our slightly higher sales growth assumption and higher net margin(4.6%vs 4.1%,based on consensus).Source:Credit Suisse estimates 18 June 2019 MAP Group 5 Table of contents Focus tables and charts 2 How to decide between MAPI and MAPA?3 Comparing MAPIs divisions based on our five key criteria for scoring retailers.3 How do we value MAPI and MAPA?.3 Choosing between MAPI and MAPA.3 Key risks.3 Key valuation comps 4 Comparing MAPIs divisions based on our five key criteria for scoring retailers 8 F&B has the highest growth potential,followed by Active and Fashion.8 Active division currently faced with the lowest competition;F&B is faced with new competition.13 Active is the most profitable division.16 F&B has the lowest working capital requirement,while Active generates the highest FCF.19 Fashion faces highest forex and import regulation risks.21 How do we value MAPI and MAPA?24 We value MAPA based on DCF.24 We use SOTP to value MAPI.27 Choosing between MAPI and MAPA?28 Growth outlook.28 MAPIs valuation discount.29 Liquidity of the stocks.29 Key risks 31 Key risks for MAPA.31 Key risks for MAPI.31 Appendix 32 Mitra Adiperkasa(MAPI.JK/MAPI IJ)34 Well-diversified retailer with strong growth potential 34 Focus charts 35 MAP Active(MAPA.JK/MAPA IJ)37 The most profitable division within MAPI 37 18 June 2019 MAP Group 6 Focus charts 38 Sportswear retailing.41 Multi-brand stores are the main distribution channel for international sportswear.42 Global brands dominate.43 Leisure footwear retailing.44 Leisure market relatively fragmented.45 Childrens apparel,toys and games retailing.45 Broad range to cover all segments 47 A leading sports retailer in Indonesia.47 Caters to sports,leisure and kids.48 Location,location,location.50 Retail vs non-retail sales.51 E-commerce.54 The uniqueness of MAPA.55 Opportunities abroad.56 Leveraging the parent companys network.56 Net profit CAGR of 24.4%(FY18-21E)57 Top-line growth of c.19.4%CAGR.57 Gross margin should improve from increase in sell-through.61 Healthy balance sheet.65 DCF derived TP at Rp8,000 68 DCF calculation.68 Key risks 70 Execution on planned store expansion.70 Failure to locate strategic locations.70 Agreements with suppliers.70 Higher rental costs.70 Higher salaries and wages.70 Failure to recognise the latest trends and timely delivery.71 Competition.71 Exchange rate fluctuations.71 Regulatory risk.71 Indonesia macro stability risk.71 Company background 72 Management.73 Stores network.76 18 June 2019 MAP Group 7 18 June 2019 MAP Group 8 Comparing MAPIs divisions based on our five key criteria for scoring retailers We compare MAPIs different divisionsActive,Fashion,F&B,and Department Storeusing the five key criteria that we use to rank other Indonesian retailers we cover(see Indonesia Retail Sector:Picking the best of retailer in Indonesia).Based on that,our conclusion is MAPIs Active division(MAPA)is overall the best division given its very dominant position in the Sports retailing segment(60%;the second-largest player with just 4%market share)and highest profitability(as measured by highest EBIT per sq m and the fastest payback period).Its main weakness is in its relatively high working capital requirement,but that has been improving over the past few years.MAPIs second-best division is its F&B business,which we think has the largest growth potential among the four major divisions,underpinned by a rising middle class and increasing budget allocation for lifestyle spending.The majority of its revenue(66%)still comes from Greater Jakarta,implying a significant potential in other cities.F&Bs biggest weakness is in the relatively low barriers of entrythis is especially the case now,with the presence of GoFood and GrabFood,the importance of strategic locations(which Starbucks has)has become less crucial.Figure 9:Credit Suisse proprietary scoring for MAPIs major divisions Source:Credit Suisse estimates F&B has the highest growth potential,followed by Active and Fashion Figure 10:Growth potential of each division Source:Credit Suisse estimates We measure the growth potential of each division based on the SSSG trend,net space additions,and potential for expansion outside Jakarta/Greater Jakarta.We conclude that F&B has the highest growth potential,followed by Active and Fashion.Department Store has the lowest growth potential,in our view,given the structural headwind from young consumers preference for specialty stores and online channels.Active division(MAPA IJ):strong SSSG and solid expansion pipeline The Active division has good growth potential,driven by consumers lifestyle changea rising middle class and increasing health consciousness.It also benefits from having a broad range of brands and store concepts t

此文档下载收益归作者所有

下载文档
收起
展开