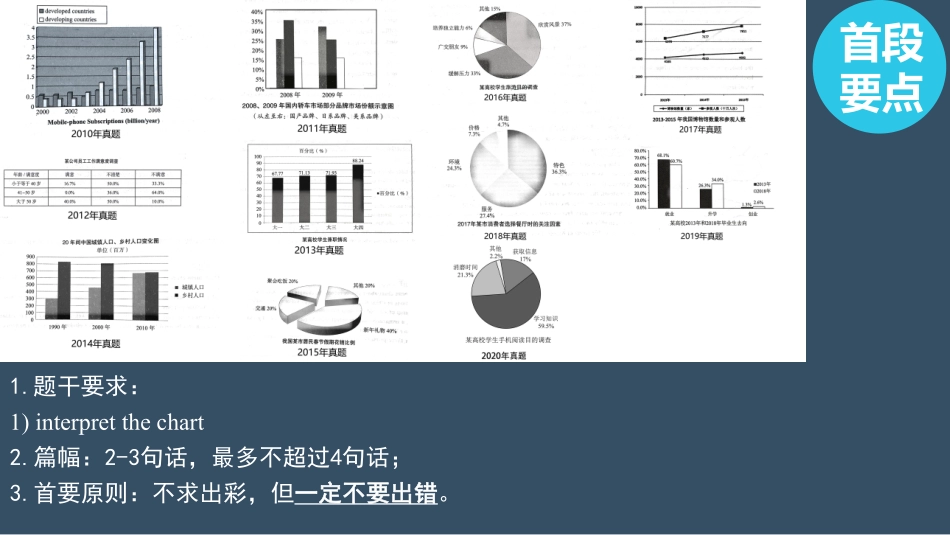
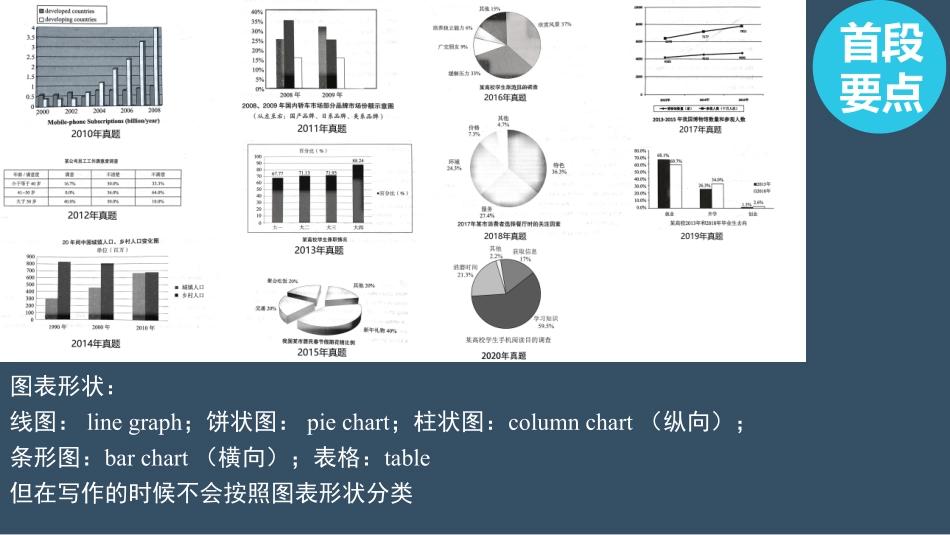
考研英语作文模板教程讲解3.首段写作方法(1)欢迎关注WX公众号见山考研首段要点1.题干要求:1)interpretthechart2.篇幅:2-3句话,最多不超过4句话;3.首要原则:不求出彩,但一定不要出错。首段要点图表形状:线图:linegraph;饼状图:piechart;柱状图:columnchart(纵向);条形图:barchart(横向);表格:table但在写作的时候不会按照图表形状分类图表分类一、动态图1.因变量随着时间改变而变化的图表,常见的是最为直观的以时间为横轴的柱状图或线图。2.时间变量不在图表的横轴中,而是在小标题里。图表分类二、静态图静态图所反映的数据没有时间变化,往往是某一个“凝固的瞬间”所展现的静态的稳定结果,实际命题中往往呈现为某种比例关系的调查结果。图表描述描述步骤1.总述;2.描述最大信息点。动态图总述句1:Thecolumnchartclearlyreflects/revealsthechangesinthestatisticsofmobile-phonesubscriptionsindevelopingcountriesanddevelopedcountriesfrom2000to2008.译文:该柱状图清晰地反映了2000年至2008年发展中国家和发达国家手机用户统计数据的变化。所包含信息:图表类型(columnchart),时间(2000to2008)、地点(indevelopingcountriesanddevelopedcountries)、统计对象(mobile-phonesubscriptions)。图表描述描述步骤1.总述;2.描述最大信息点。动态图总述句2:Whattheabovecolumnchartdisplaysarethechangesinthestatisticsofmobile-phonesubscriptionsindevelopingcountriesanddevelopedcountriesfrom2000to2008.译文:上面的柱状图展现的是2000年至2008年发展中国家和发达国家手机用户统计数据的变化。图表描述描述步骤1.总述;2.描述最大信息点。2.数据描述句1:Wecanseeamarkedincreaseinthefigureformobilephonesubscriptionsindevelopingcountries,from0.4billionin2000to4billionin2008.译文:我们可以看出从2000年到2008年,发展中国家的手机用户数量显著上升,从4亿到40亿。数据描述句2:Therewasadramaticincreaseinthefigureformobilephonesubscriptionsindevelopingcountries,from0.4billionin2000to4billionin2008.译文:发展中国家的手机用户数量急剧增长,从2000年的4亿增长到2008年的40亿。图表描述描述步骤1.总述;2.描述最大信息点。总述+描述句3:Whattheabovecolumnchartdisplaysisthatintheemergingmarkets,therewasasurgeofmobilephonesubscriptionswhichsoaredfrom0.4billionin2000to4billi...