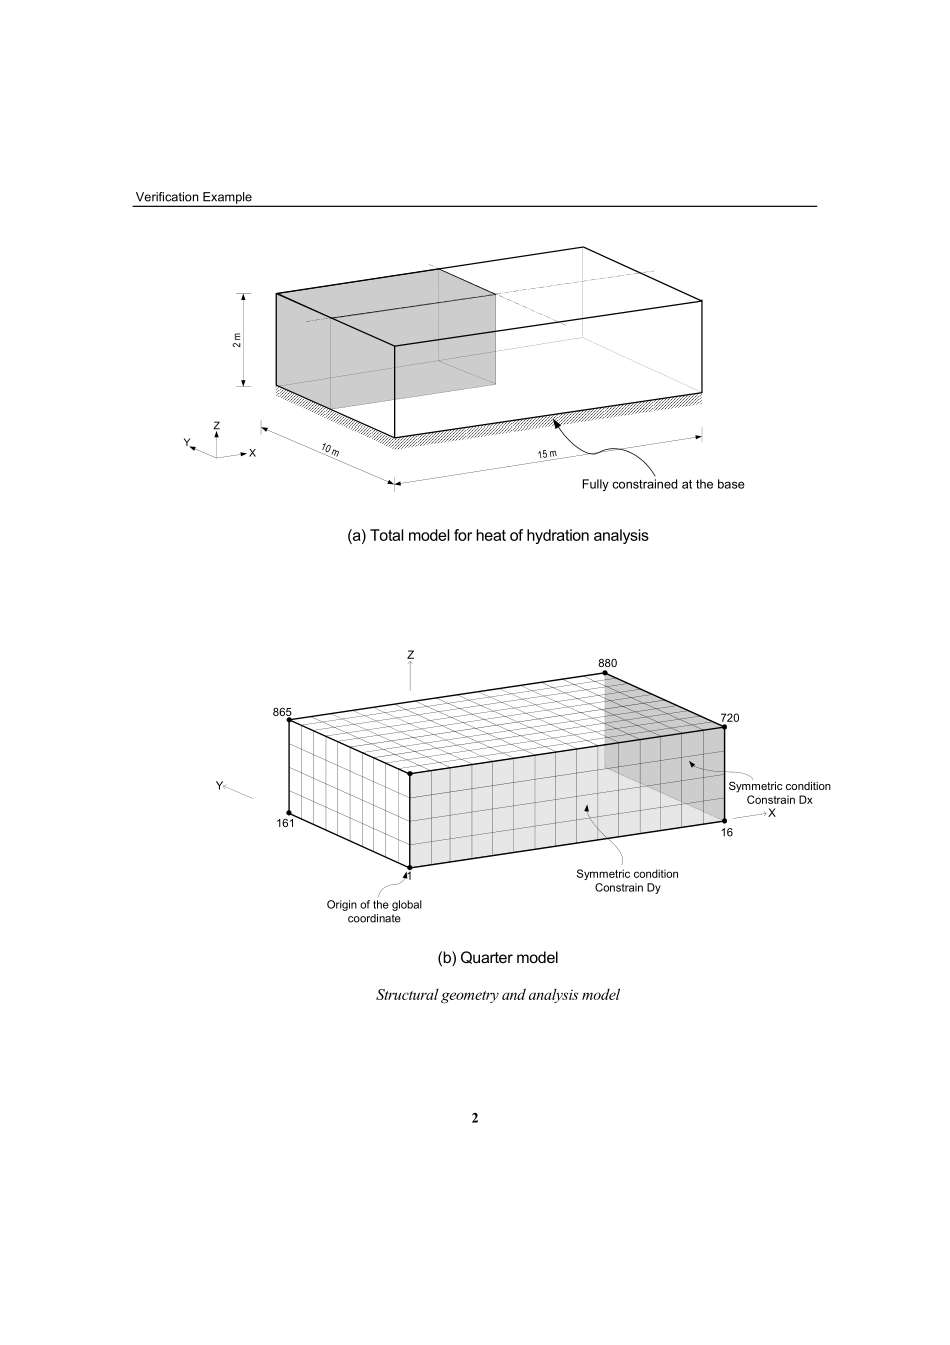
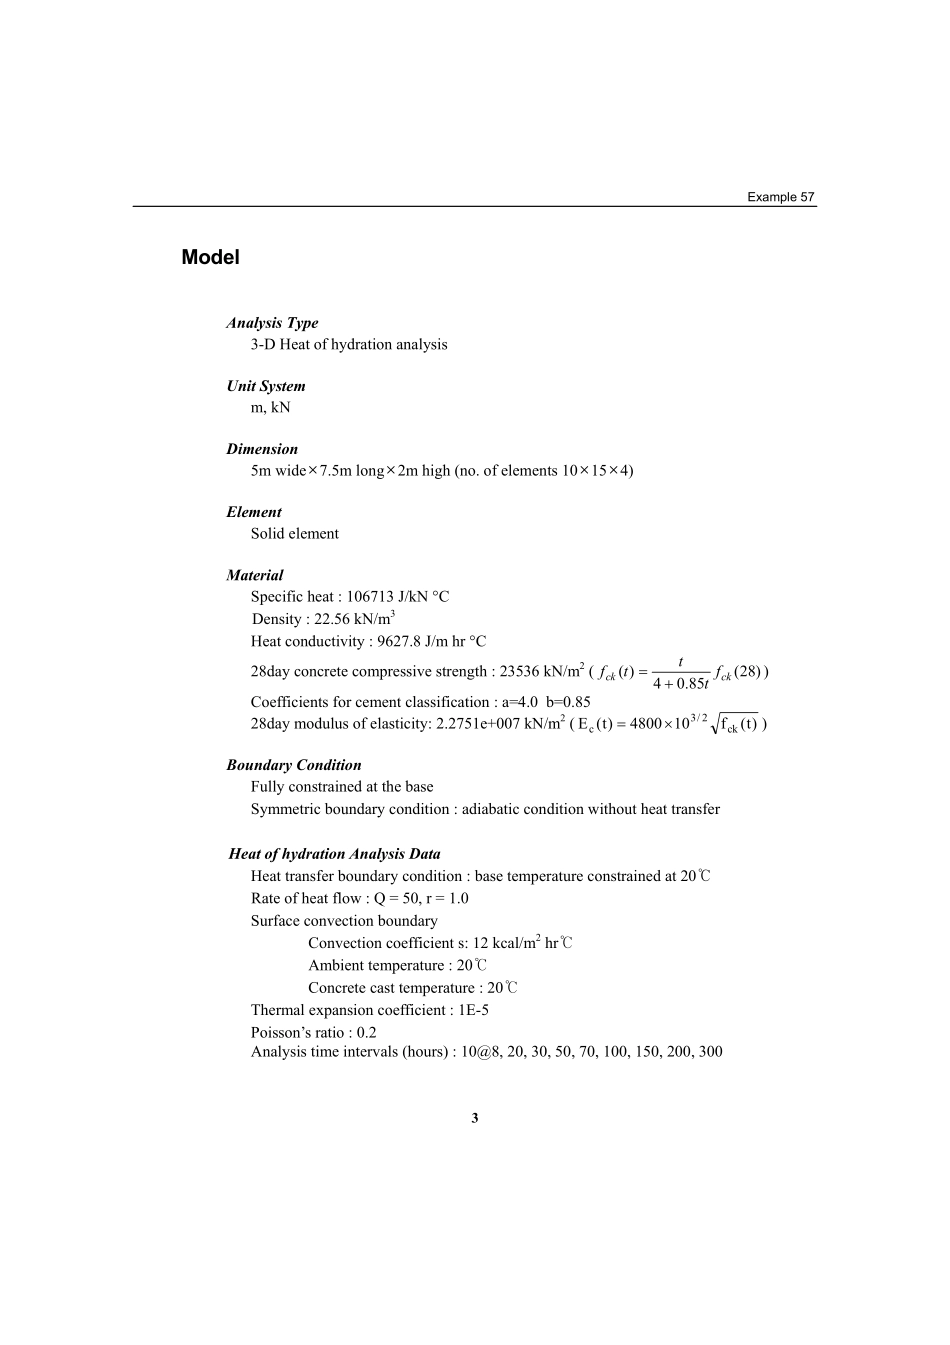
1Example57TitleHeatofhydrationanalysisofaquarterofarectangularmodelDescriptionGivenisamassfootingconcreteconstrainedatthebase.Thefootingdimensionsare10mwide×15mlong×2mthick.Usingthesymmetry,a1/4modelwillbeusedtorepresentthetotalmassforaheatofhydrationanalysis.Wewillexaminethetimevarianttemperaturesandstressesatthesurfaceandcenter.VerificationExample2Z15m10m2mXY(a)Totalmodelforheatofhydrationanalysis(b)QuartermodelStructuralgeometryandanalysismodelFullyconstrainedatthebaseOriginoftheglobalcoordinate1880865161SymmetricconditionConstrainDySymmetricconditionConstrainDxYXZ16720Example573ModelAnalysisType3-DHeatofhydrationanalysisUnitSystemm,kNDimension5mwide×7.5mlong×2mhigh(no.ofelements10×15×4)ElementSolidelementMaterialSpecificheat:106713J/kN°CDensity:22.56kN/m3Heatconductivity:9627.8J/mhr°C28dayconcretecompressivestrength:23536kN/m2()28(85.04)(ckckftttf+=)Coefficientsforcementclassification:a=4.0b=0.8528daymodulusofelasticity:2.2751e+007kN/m2()t(f104800)t(Eck2/3c×=)BoundaryConditionFullyconstrainedatthebaseSymmetricboundarycondition:adiabaticconditionwithoutheattransferHeatofhydrationAnalysisDataHeattransferboundarycondition:basetemperatureconstrainedat20℃Rateofheatflow:Q=50,r=1.0SurfaceconvectionboundaryConvectioncoefficients:12kcal/m2hr℃Ambienttemperature:20℃Concretecasttemperature:20℃Thermalexpansioncoefficient:1E-5Poisson’sratio:0.2Analysistimeintervals(hours):10@8,20,30,50,70,100,150,200,300VerificationExample4ResultsTemperatureTemperaturedistributionatthetimeofthemax.temperature(Step:5,50hours)Temperaturetimehistorycurveatthecenter(Node368)Example575Temperaturetimehistorycurveatthesurface(Node720)VerificationExample6StressStressdistributionwhenthestressatthecenterreachesthehighestStresstimehistorycurveatthecenter(Node368)Example577StressdistributionwhenthestressatthesurfacereachesthehighestStresstimehistorycurveatthesurface(Node865)VerificationExample8ComparisonofResultsNodalTemperatureLocationNode368(Center)Node720(Surface)Time(hours)MIDAS/Gen(°C)DIANA(°C)MIDAS/Gen(°C)DIANA(°C)0202020201037.236.832.732.42048.147.535.134.83054.653.934.934.5405857.233.933.75059.358.532.932.66059.258.331.931.67058.157.330.930.78056.555.830.129.810052.651.928.528.313046.545.826.726.51803837.424.524.325030.229.822.522.435024.324.221.121.150021.121.120.320.370020.120.22020100020202020Example579Temperaturetimehistorycurveatthecenter(Node368)Temperaturetimehistorycurveatthesurface(Node720)010203040506070020040060080010001200Time(Hr)Temperature(℃)MIDAS/GenDIANA0510152025303540020040060080010001200Time(Hr)Temperature(℃)MIDAS/GenDIANAVerificationExample10Reference“DIANA”,Release7,TNOBuildingandConstructionResearch,1998.