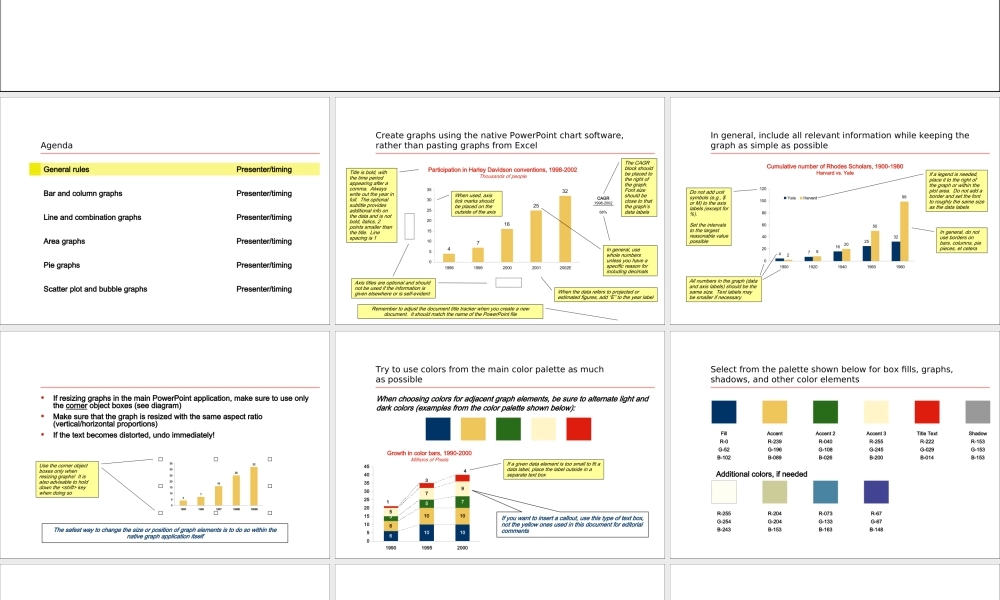
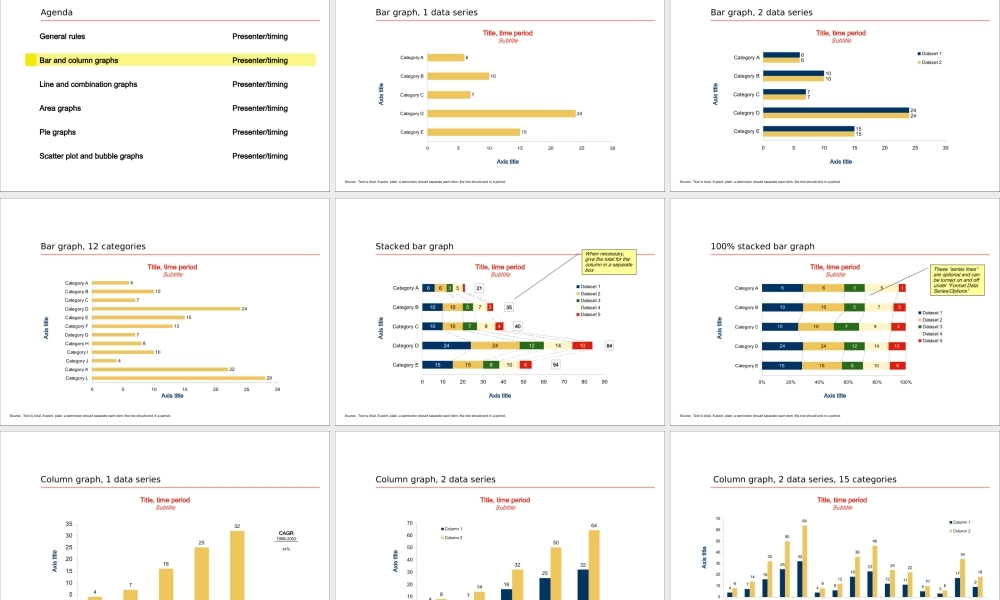
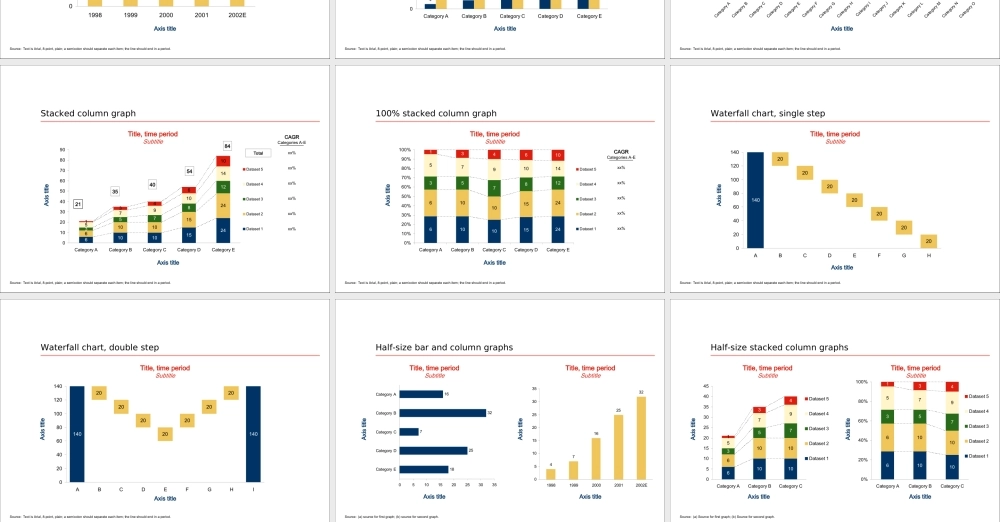
Templates–GraphsUSBusinessGroupGeneralrulesPresenter/timingBarandcolumngraphsPresenter/timingLineandcombinationgraphsPresenter/timingAreagraphsPresenter/timingPiegraphsPresenter/timingScatterplotandbubblegraphsPresenter/timingAgendaCreategraphsusingthenativePowerPointchartsoftware,ratherthanpastinggraphsfromExcelParticipationinHarleyDavidsonconventions,1998-2002ThousandsofpeopleCAGR1998-200268%471625320510152025303519981999200020012002ETitleisbold,withthetimeperiodappearingafteracomma.Alwayswriteouttheyearinfull.Theoptionalsubtitleprovidesadditionalinfoonthedataandisnotbold,italics,2pointssmallerthanthetitle.Linespacingis1Axistitlesareoptionalandshouldnotbeusediftheinformationisgivenelsewhereorisself-evidentTheCAGRblockshouldbeplacedtotherightofthegraph.Fontsizeshouldbeclosetothatthegraph’sdatalabelsIngeneral,usewholenumbersunlessyouhaveaspecificreasonforincludingdecimalsWhenthedatareferstoprojectedorestimatedfigures,add“E”totheyearlabelWhenused,axistickmarksshouldbeplacedontheoutsideoftheaxisRemembertoadjustthedocumenttitletrackerwhenyoucreateanewdocument.ItshouldmatchthenameofthePowerPointfileIngeneral,includeallrelevantinformationwhilekeepingthegraphassimpleaspossibleCumulativenumberofRhodesScholars,1900-1980Harvardvs.Yale471625322820509902040608010012019001920194019601980YaleHarvardAllnumbersinthegraph(dataandaxislabels)shouldbethesamesize.TextlabelsmaybesmallerifnecessaryDonotaddunitsymbols(e.g.,$orM)totheaxislabels(exceptfor%).SettheintervalstothelargestreasonablevaluepossibleIngeneral,donotusebordersonbars,columns,piepieces,etceteraIfalegendisneeded,placeittotherightofthegraphorwithintheplotarea.DonotaddaborderandsetthefonttoroughlythesamesizeasthedatalabelsIfresizinggraphsinthemainPowerPointapplication,makesuretouseonlythecornerobjectboxes(seediagram)Makesurethatthegraphisresizedwiththesameaspectratio(vertical/horizontalproportions)Ifthetextbecomesdistorted,undoimmediately!Thesafestwaytochangethesizeorpositionofgraphelementsistodosowithinthenati...