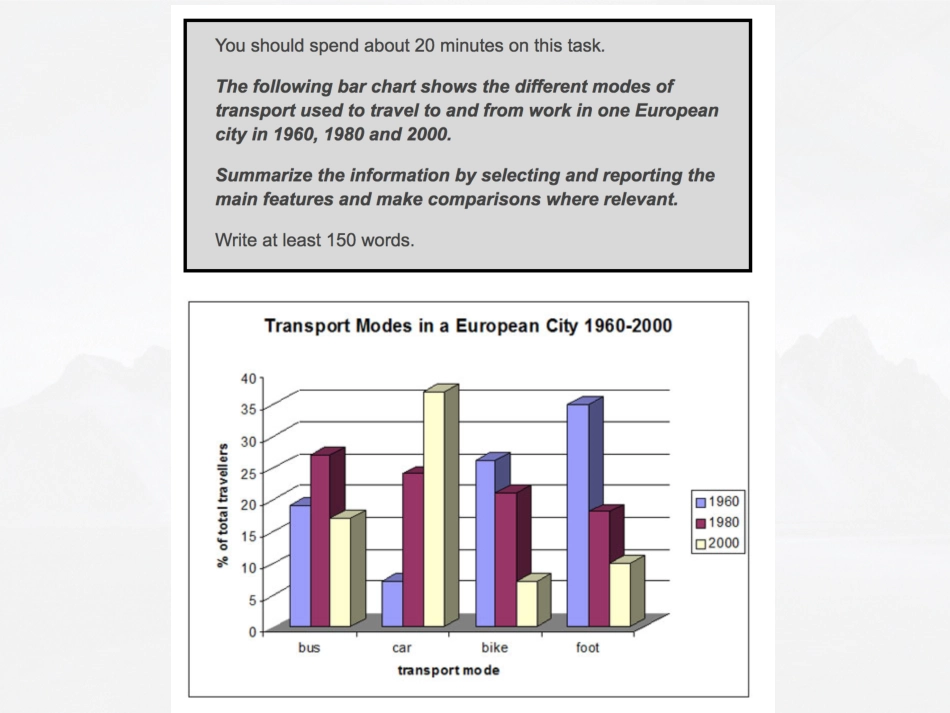
PAPA����Lesson2JackShaw�������ThebarchartshowsthechangingpatternsoftransportuseinaEuropeancityduringtheperiodfrom1960to2000.Itisclearthattheuseofthecarasameansoftransportdramaticallyincreasedovertheperiod,whiletheothersfell.Indetail,in1960themotorcarwasusedleastasamethodoftransportwithonlyabout7%ofthepopulationusingthismethodbutcarusegrewsteadilyandstronglytofinallyreachabout37%ofthepopulationby2000.Thiswasamassive5-foldincreaseinuse.Overthissameperiod,however,thepopularityofwalking,whichhadbeenthemostpopularmeansoftransportwith35%ofthepopulationin1960havingitastheirpreferredwayofgettingaround,fellto10%.Bicycleusealsofellfromahighofabout27%in1960tojust7%in2000.Ontheotherhand,bususewasmoreerraticbeingpopularwithalmost20%ofthepopulationin1960andrisingtoapeakofabout27%in1980beforefallingbacktoabout18%in2000.ThetwopiechartsillustratetheproportionoffivetypesofenergyproductioninFrancein1995and2005.Overall,inbothyears,themostsignificantsourcesofenergyweregasandcoal,whichtogetheraccountedforoverhalftheproductionofenergy,whilenuclearandotherkindsofenergysourcesgeneratedtheleastamountofenergyinFrance.Inalltypesofenergyproductiontherewasonlyminimalchangeoverthe10yearperiod.Energyproducedbycoalcomprisedof29.80%inthefirstyearandthisshowedonlyaveryslightincreaseofaboutamere1%to30.9%in2005.Likewise,in1995,gasgenerated29.63%whichrosemarginallyto30.1%10yearslater.Withregardstotheremainingmethodsofproducingenergy,therewasanapproximate5%growthinproductionfrombothnuclearpowerandothersourcesto10.10%and9.10%respectively.Petrol,ontheotherhand,wastheonlysourceofenergywhichdecreasedinproductionfrom29.27%in1995toaroundafifth(19.55%)in2005.��2--��Thechartbelowshowsthetotalnumberofminutes(inbillions)oftelephonecallsintheUK,dividedintothreecategories,from1995-2002.Summarizetheinformationbyselectingandreportingthemainfeatures,andmakecomparisonswhererelevant.ThechartshowsthetimespentbyUKresidentsondifferenttypesoftelephonecallsbetween1995and2002.Localfixedlinecallswerethehighest...