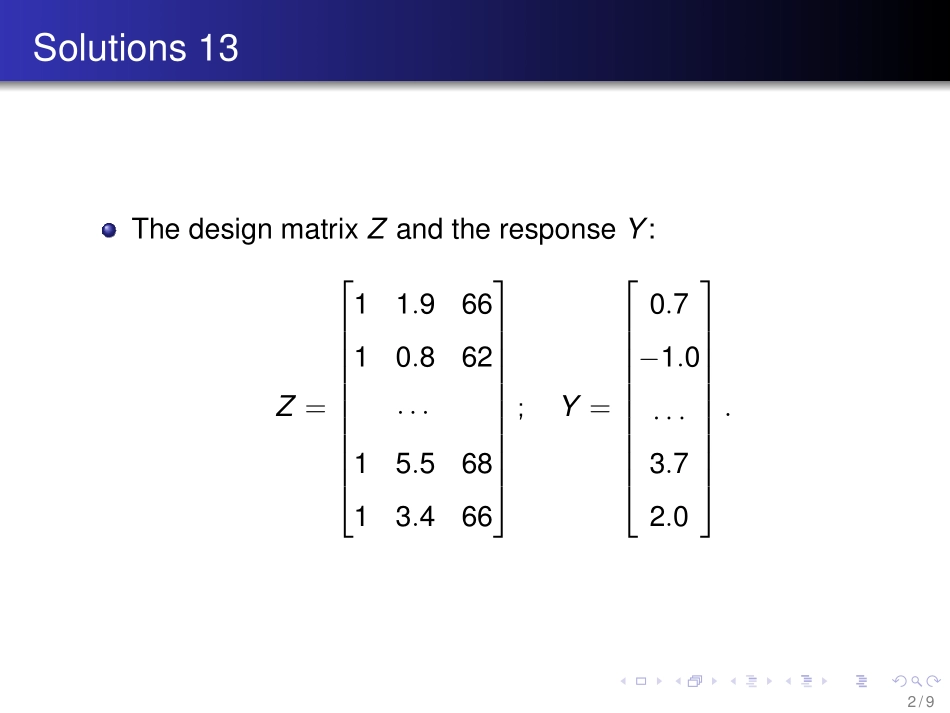
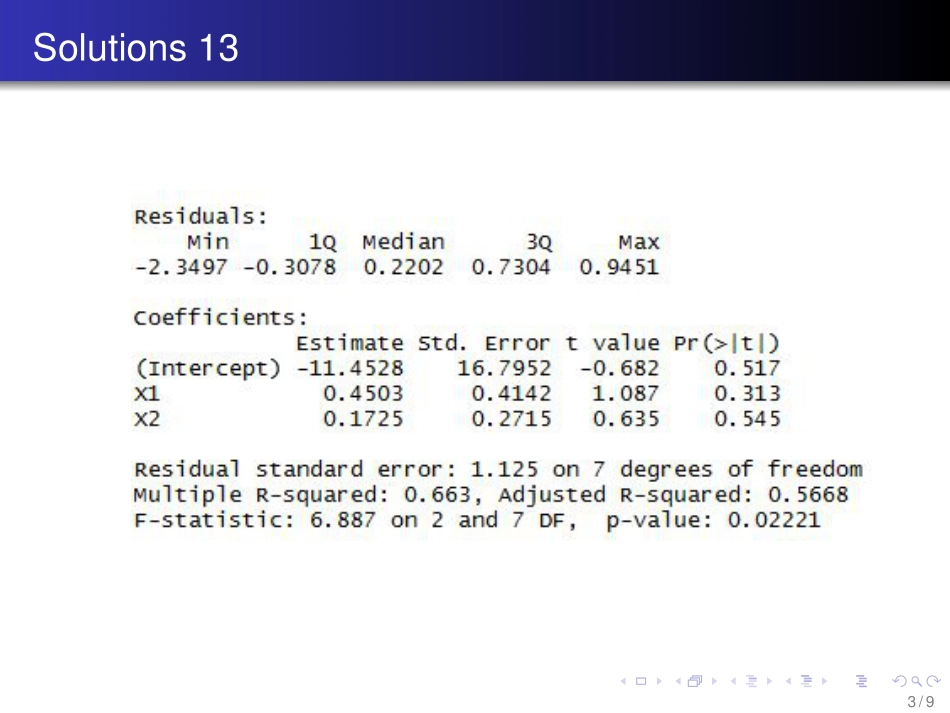
........ProbabilityandStatisticsSolutions13GuanghuaSchoolofManagementPekingUniversityDecember29,20121/9.......Solutions13ThedesignmatrixZandtheresponseY:Z=11.96610.862···15.56813.466;Y=0.7−1.0...3.72.0.2/9.......Solutions133/9.......Solutions13(a).ThentheM.L.E.ofˆβ0,ˆβ1,ˆβ2areˆβ0ˆβ1ˆβ2=(ZTZ)−1(ZTY)=−11.45280.45030.1725.Fromthesoftware,theunbiasedestimatorandM.L.Eofσ2arerespectively,σ′2=1n−k−1S2=(1.125)2;ˆσ2=1nS2=710(1.125)2=0.886.4/9.......Solutions13(b).WeusetheTtesttotestβ1,underH0,U1=ˆβ1−β∗1sˆβ1∼tn−k−1,whereβ∗1=0,ˆβ1=0.4503,sˆβ1=0.4142,n=10,k=2.ThenU1=1.08778.Pvalueisp=Pr(|t7|>U1)=0.313.5/9.......Solutions13(c)Weusethesamestatisticin(b),whereβ∗2=−1,ˆβ1=0.1725,sˆβ1=0.2715,thenU2=4.32015.Pvalueofthetestisp=Pr(|t7|>U2)=0.0035.6/9.......Solutions13(d)TotestH0,weusetheFstatistic,underH0,F=SSR/kSSE/(n−k−1)=n∑i=1(ˆyi−¯yn)2/kn∑i=1(yi−ˆyi)2/(n−k−1)∼Fk,n−k−1.Fromthesoftware,weobtainF=6.887,thenthePvalueofthetestisp=Pr(F2,7>6.887)=0.0221.7/9.......Solutions13(e)Fromthesoftware,theR2isR2=SSRSST=n∑i=1(ˆyi−¯yn)2n∑i=1(yi−¯yn)2=0.663.8/9.......Solutions13(f)Thepredictedvalueˆy=ˆβ0+ˆβ1x1+ˆβ2x2=−11.4528+0.4503×4+0.1725×65=1.5609.Becauset7,0.025=2.3646,σ′=1.125,˜z=(1,4,65)T.Thenthe95%predictionintervalis[ˆy−t7,0.025σ′√1+˜zT(ZTZ)−1˜z,ˆy+t7,0.025σ′√1+˜zT(ZTZ)−1˜z],Thentheintervalis[−1.6729,4.7948]9/9