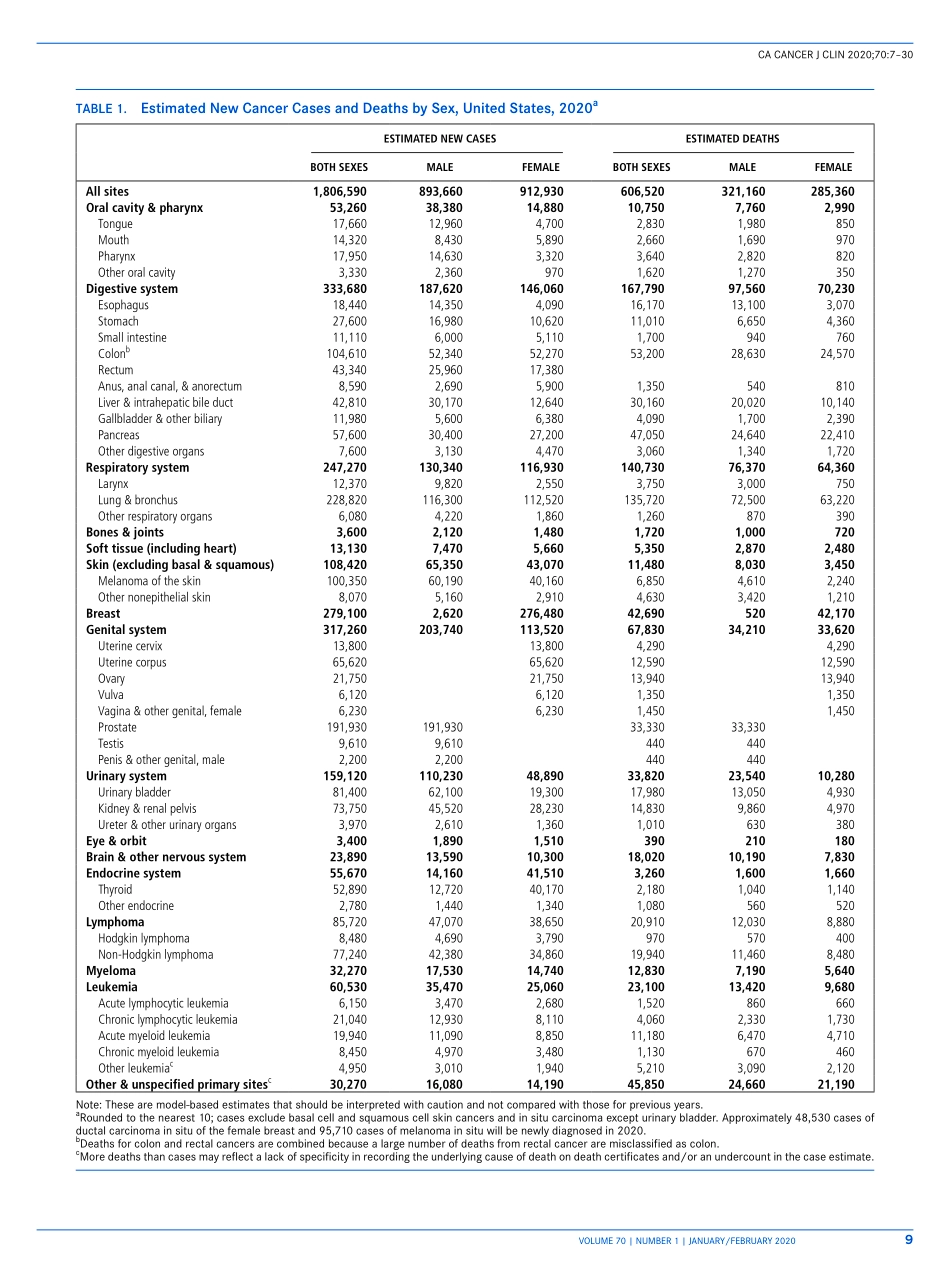
分享
Cancer Statistics, 2020.pdf
下载文档

ID:3113094

大小:1.13MB

页数:24页

格式:PDF

时间:2024-01-20

收藏 分享赚钱
温馨提示:
1. 部分包含数学公式或PPT动画的文件,查看预览时可能会显示错乱或异常,文件下载后无此问题,请放心下载。
2. 本文档由用户上传,版权归属用户,汇文网负责整理代发布。如果您对本文档版权有争议请及时联系客服。
3. 下载前请仔细阅读文档内容,确认文档内容符合您的需求后进行下载,若出现内容与标题不符可向本站投诉处理。
4. 下载文档时可能由于网络波动等原因无法下载或下载错误,付费完成后未能成功下载的用户请联系客服处理。
网站客服:3074922707
Cancer Statistics 2020 Statistics
CA CANCER J CLIN 2020;70:7307VOLUME 70|NUMBER 1|JANUARY/FEBRUARY 2020Abstract:Each year,the American Cancer Society estimates the numbers of new can-cer cases and deaths that will occur in the United States and compiles the most recent data on population-based cancer occurrence.Incidence data(through 2016)were collected by the Surveillance,Epidemiology,and End Results Program;the National Program of Cancer Registries;and the North American Association of Central Cancer Registries.Mortality data(through 2017)were collected by the National Center for Health Statistics.In 2020,1,806,590 new cancer cases and 606,520 cancer deaths are projected to occur in the United States.The cancer death rate rose until 1991,then fell continuously through 2017,resulting in an overall decline of 29%that trans-lates into an estimated 2.9 million fewer cancer deaths than would have occurred if peak rates had persisted.This progress is driven by long-term declines in death rates for the 4 leading cancers(lung,colorectal,breast,prostate);however,over the past decade(2008-2017),reductions slowed for female breast and colorectal cancers,and halted for prostate cancer.In contrast,declines accelerated for lung cancer,from 3%annually during 2008 through 2013 to 5%during 2013 through 2017 in men and from 2%to almost 4%in women,spurring the largest ever single-year drop in overall cancer mortality of 2.2%from 2016 to 2017.Yet lung cancer still caused more deaths in 2017 than breast,prostate,colorectal,and brain cancers combined.Recent mor-tality declines were also dramatic for melanoma of the skin in the wake of US Food and Drug Administration approval of new therapies for metastatic disease,escalating to 7%annually during 2013 through 2017 from 1%during 2006 through 2010 in men and women aged 50 to 64 years and from 2%to 3%in those aged 20 to 49 years;annual declines of 5%to 6%in individuals aged 65 years and older are particularly striking because rates in this age group were increasing prior to 2013.It is also nota-ble that long-term rapid increases in liver cancer mortality have attenuated in women and stabilized in men.In summary,slowing momentum for some cancers amena-ble to early detection is juxtaposed with notable gains for other common cancers.CA Cancer J Clin 2020;70:7-30.2020 American Cancer Society.Keywords:cancer cases,cancer statistics,death rates,incidence,mortalityIntroductionCancer is a major public health problem worldwide and is the second leading cause of death in the United States.In this article,we provide the estimated numbers of new cancer cases and deaths in 2020 in the United States nationally and for each state,as well as a comprehensive overview of cancer occurrence based on the most current population-based data for cancer incidence through 2016 and for mortality through 2017.We also estimate the total number of cancer deaths averted because of the continuous decline in cancer death rates since the early 1990s.Materials and MethodsIncidence and Mortality DataMortality data from 1930 to 2017 were provided by the National Center for Health Statistics(NCHS).1,2 Forty-seven states and the District of Columbia met data quality requirements for reporting to the national vital statistics system in 1930,and Texas,Alaska,and Hawaii began reporting in 1933,1959,and 1960,respectively.The methods for abstraction and age adjustment of historic mortality Cancer Statistics,2020Rebecca L.Siegel,MPH1;Kimberly D.Miller,MPH1;Ahmedin Jemal,DVM,PhD11Surveillance and Health Services Research,American Cancer Society,Atlanta,Georgia.Corresponding Author:Rebecca L.Siegel,MPH,Surveillance Research,American Cancer Society,250 Williams St,NW,Atlanta,GA 30303-1002;(Rebecca.siegelcancer.org).DISCLOSURES:All authors are employed by the American Cancer Society,which receives grants from private and corporate foundations,including foundations associated with companies in the health sector for research outside of the submitted work.The authors are not funded by or key personnel for any of these grants and their salary is solely funded through American Cancer Society funds.We gratefully acknowledge all cancer registries and their staff for their hard work and diligence in collecting cancer information,without which this research could not have been done.doi:10.3322/caac.21590.Available online at Cancer Statistics,20208CA:A Cancer Journal for Cliniciansdata are described elsewhere.2,3 Five-year mortality rates(2012-2016)for Puerto Rico were previously published in volume 3 of the North American Association of Central Cancer Registries(NAACCRs)Cancer in North America:2012-2016.4Population-based cancer incidence data in the United States have been collected by the National Cancer Institutes(NCI)Surveillance,Epidemiology,and End Results(SEER)Program since 1973 and by the Centers for Disease Control and Preventions(CDCs)National Program of Cancer Registries(NPCR)since 1995.The SEER program is the only source for historic popula-tion-based incidence data.Long-term(1975-2016)inci-dence and survival trends were based on data from the 9 oldest SEER areas(Connecticut,Hawaii,Iowa,New Mexico,Utah,and the metropolitan areas of Atlanta,Detroit,San FranciscoOakland,and SeattlePuget Sound),representing approximately 9%of the US popu-lation.5 Contemporary stage distribution and survival sta-tistics were based on data from all 18 SEER registries(the SEER 9 registries plus Alaska Natives,California,Georgia,Kentucky,Louisiana,and New Jersey).6 The probability of developing cancer was based on all 21 SEER registries(the SEER 18 registries plus Idaho,Massachusetts,and New York)and calculated using the NCIs DevCan soft-ware(version 6.7.7).7 Some of the statistical information presented herein was adapted from data previously pub-lished in the SEER Cancer Statistics Review 1975-2016.8The NAACCR compiles and reports incidence data from 1995 onward for registries that participate in the SEER pro-gram and/or the NPCR.These data approach 100%cover-age of the US population for the most recent years and were the source for the projected new cancer cases in 2020 and cross-sectional incidence rates by state and race/ethnicity.9,10 Some of the incidence data presented herein were previously published in volumes 1 and 2 of Cancer in North America:2012-2016.11,12All cancer cases were classified according to the International Classification of Diseases for Oncology except childhood and adolescent cancers,which were classified according to the International Classification of Childhood Cancer(ICCC).13,14 Causes of death were classified according to the International Classification of Diseases.15 All incidence and death rates were age standardized to the 2000 US standard population and expressed per 100,000 population,as calculated by the NCIs SEER*Stat software(version 8.3.6).16 The annual percent change in rates was quantified using the NCIs Joinpoint Regression Program(version 4.7.0.0).17Whenever possible,cancer incidence rates were adjusted for delays in reporting,which occur because of a lag in case capture or data corrections.Delay-adjustment has the largest effect on the most recent data years for cancers that are frequently diagnosed in outpatient set-tings(eg,melanoma,leukemia,and prostate cancer)and provides the most accurate portrayal of cancer occurrence in the most recent time period.18 For example,the leuke-mia incidence rate for 2016 in the 9 oldest SEER regis-tries was 10%higher after adjusting for reporting delays (15.2 vs 13.8 per 100,000 population).8Projected Cancer Cases and Deaths in 2020The most recent year for which reported incidence and mor-tality data are available lags 2 to 4years behind the current year due to the time required for data collection,compila-tion,quality control,and dissemination.Therefore,we pro-jected the numbers of new cancer cases and deaths in the United States in 2020 to provide an estimate of the contem-porary cancer burden.To calculate the number of invasive cancer cases,a gen-eralized linear mixed model was used to estimate complete counts for each county(or health service area for rare cancers)from 2002 through 2016 using delay-adjusted,high-quality incidence data from 49 states and the District of Columbia(98%population coverage)and geographic variations in sociodemographic and lifestyle factors,medical settings,and cancer screening behaviors.19(Data were unavailable for all years for Kansas and for a few sporadic years for a limited number of other states.)Modeled counts were aggregated to the national and state level for each year,and a time series projection method(vector autoregression)was applied to all 15years to estimate cases for 2020.Basal cell and squamous cell skin cancers cannot be estimated because incidence data are not collected by most cancer registries.For complete details of the case projection methodology,please refer to Zhu et al.20New cases of ductal carcinoma in situ of the female breast and in situ melanoma of the skin diagnosed in 2020 were estimated by first approximating the number of cases occurring annually from 2007 through 2016 based on age-specific NAACCR incidence rates(data from 49 states with high-quality data for all 10years)and US Census Bureau population estimates obtained via SEER*Stat.9,21 Counts were then adjusted for delays in reporting using SEER delay factors for invasive disease(delay factors are unavailable for in situ cases)and projected to 2020 based on the average annual percent change generated by the joinpoint regression model.22The number of cancer deaths expected to occur in 2020 was estimated based on the most recent joinpoint-generated annual percent change in reported cancer deaths from 2003 through 2017 at the state and national levels as reported to the NCHS.For the complete details of this methodology,please refer to Chen et al.23CA CANCER J CLIN 2020;70:7309VOLUME 70|NUMBER 1|JANUARY/FEBRUARY 2020TABLE 1.Estimated New Cancer Cases and Deaths by Sex,United States,2020a ESTIMATED NEW CASESESTIMATED DEATHSBOTH SEXESMALEFEMALEBOTH SEXESMALEFEMALEAll sites1,806,590893,660912,930606,520321,160285,360Oral cavity&pharynx53,26038,38014,88010,7507,7602,990Tongue17,66012,9604,7002,8301,980850Mouth14,3208,4305,8902,6601,690970Pharynx17,95014,6303,3203,6402,820820Other oral cavity3,3302,3609701,6201,270350Digestive system333,680187,620146,060167,79097,56070,230Esophagus18,44014,3504,09016,17013,1003,070Stomach27,60016,98010,62011,0106,6504,360Small intestine11,1106,0005,1101,700940760Colonb 104,61052,34052,27053,20028,63024,570Rectum43,34025,96017,380Anus,anal canal,&anorectum8,5902,6905,9001,350540810Liver&intrahepatic bile duct42,81030,17012,64030,16020,02010,140Gallbladder&other biliary11,9805,6006,3804,0901,7002,390Pancreas57,60030,40027,20047,05024,64022,410Other digestive organs7,6003,1304,4703,0601,3401,720Respiratory system247,270130,340116,930140,73076,37064,360Larynx12,3709,8202,5503,7503,000750Lung&bronchus228,820116,300112,520135,72072,50063,220Other respiratory organs6,0804,2201,8601,260870390Bones&joints3,6002,1201,4801,7201,000720Soft tissue(including heart)13,1307,4705,6605,3502,8702,480Skin(excluding basal&squamous)108,42065,35043,07011,4808,0303,450Melanoma of the skin100,35060,19040,1606,8504,6102,240Other nonepithelial skin8,0705,1602,9104,6303,4201,210Breast279,1002,620276,48042,69052042,170Genital system317,260203,740113,52067,83034,21033,620Uterine cervix13,80013,8004,2904,290Uterine corpus65,62065,62012,59012,590Ovary21,75021,75013,94013,940Vulva6,1206,1201,3501,350Vagina&other genital,female6,2306,2301,4501,450Prostate191,930191,93033,33033,330Testis9,6109,610440440Penis&other genital,male2,2002,200440440Urinary system159,120110,23048,89033,82023,54010,280Urinary bladder81,40062,10019,30017,98013,0504,930Kidney&renal pelvis73,75045,52028,23014,8309,8604,970Ureter&other urinary organs3,9702,6101,3601,010630380Eye&orbit3,4001,8901,510390210180Brain&other nervous system23,89013,59010,30018,02010,1907,830Endocrine system55,67014,16041,5103,2601,6001,660Thyroid52,89012,72040,1702,1801,0401,140Other endocrine2,7801,4401,3401,080560520Lymphoma85,72047,07038,65020,91012,0308,880Hodgkin lymphoma8,4804,6903,790970570400Non-Hodgkin lymphoma77,24042,38034,86019,94011,4608,480Myeloma32,27017,53014,74012,8307,1905,640Leukemia60,53035,47025,06023,10013,4209,680Acute lymphocytic leukemia6,1503,4702,6801,520860660Chronic lymphocytic leukemia21,04012,9308,1104,0602,3301,730Acute myeloid leukemia19,94011,0908,85011,1806,4704,710Chronic myeloid leukemia8,4504,9703,4801,130670460Other leukemiac 4,9503,0101,9405,2103,0902,120Other&unspecified primary sitesc 30,27016,08014,19045,85024,66021,190Note:These are model-based estimates that should be interpreted with caution and not compared with those for previous years.aRounded to the nearest 10;cases exclude basal cell and squamous cell skin cancers and in situ carcinoma except urinary bladder.Approximately 48,530 cases of ductal carcinoma in situ of the female breast and 95,710 cases of melanoma in situ will be newly diagnosed in 2020.bDeaths for colon and rectal cancers are combined because a large number of deaths from rectal cancer are misclassified as colon.cMore deaths than cases may reflect a lack of specificity in recording the underlying cause of death on death certificates and/or an undercount in the case estimate.Cancer Statistics,202010CA:A Cancer Journal for CliniciansOther StatisticsThe number of cancer deaths averted in men and women due to the reduction in cancer death rates since the early 1990s was estimated by summing the difference between the annual num-ber of recorded cancer deaths from the number that would have been expected if cancer death rates had remained at their peak.The expected number of deaths was estimated by applying the 5-year age-and sex-specific cancer death rates in the peak year for age-standardized cancer death rates(1990 in men and 1991 in women)to the corresponding age-and sex-specific popula-tions in subsequent years through 2017.Selected FindingsExpected Numbers of New Cancer CasesTable 1 presents the estimated numbers of new invasive can-cer cases in the United States in 2020 by sex and cancer type.In total,there will be approximately 1,806,590 cancer cases diagnosed,which is the equivalent of approximately 4,950 new cases each day.In addition,there will be approximately 48,530 new cases of ductal carcinoma in situ of the breast diagnosed in women and 95,710 new cases of melanoma in situ of the skin.The estimated numbers of new cases by state are shown in Table 2.Figure 1 depicts the most common cancers expected to be diagnosed in men and women in 2020.Prostate,lung and bronchus(referred to as lung hereafter),and colorectal can-cers(CRCs)account for 43%of all cases in men,with prostate cancer alone accounting for more than 1 in 5 new diagnoses.For women,the 3 most common cancers are breast,lung,and colorectal,accounting for 50%of all new diagnoses;breast cancer alone accounts for 30%of female

此文档下载收益归作者所有

下载文档
收起
展开