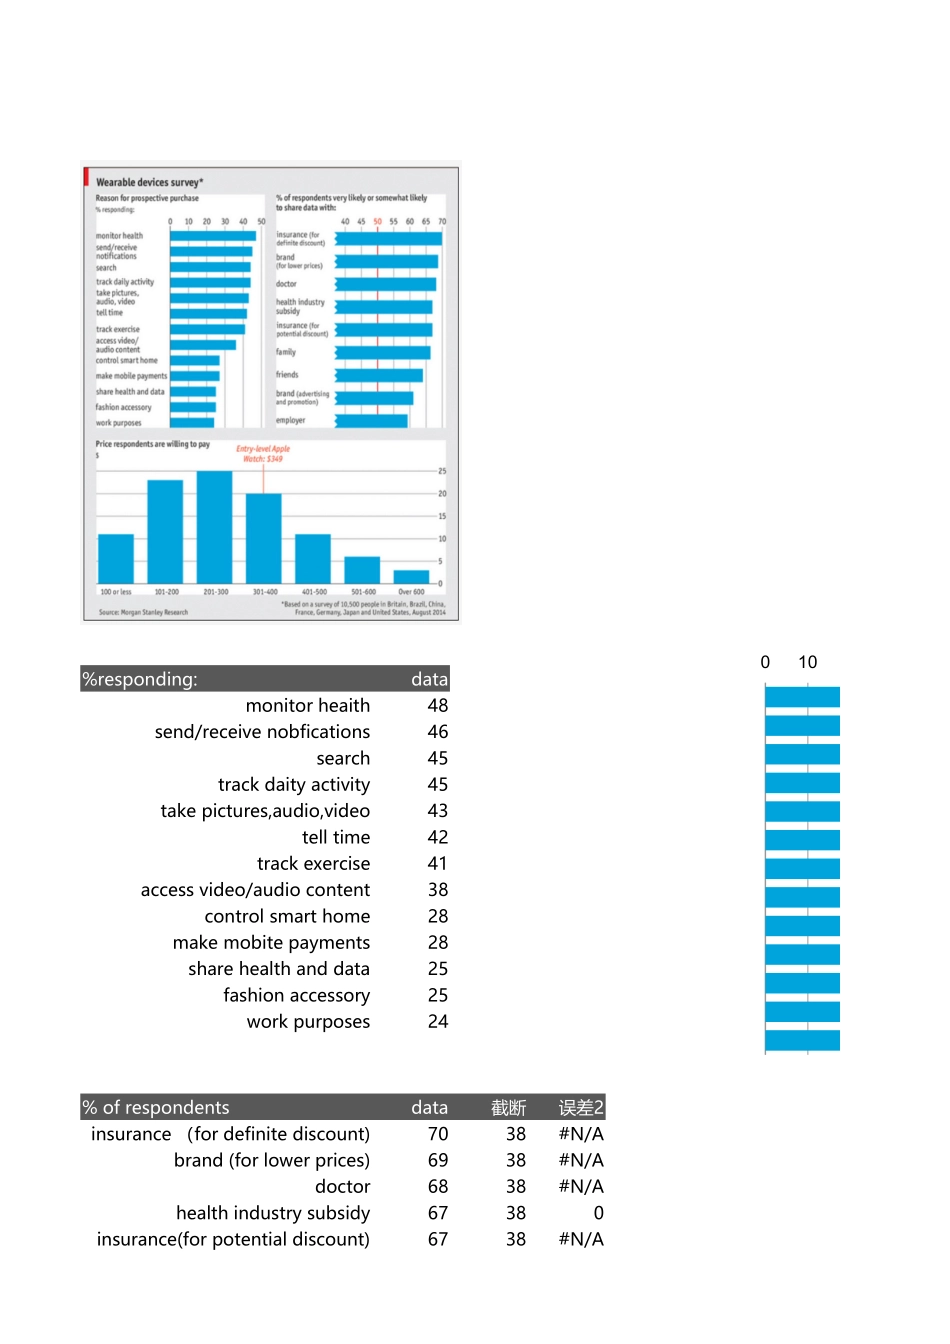
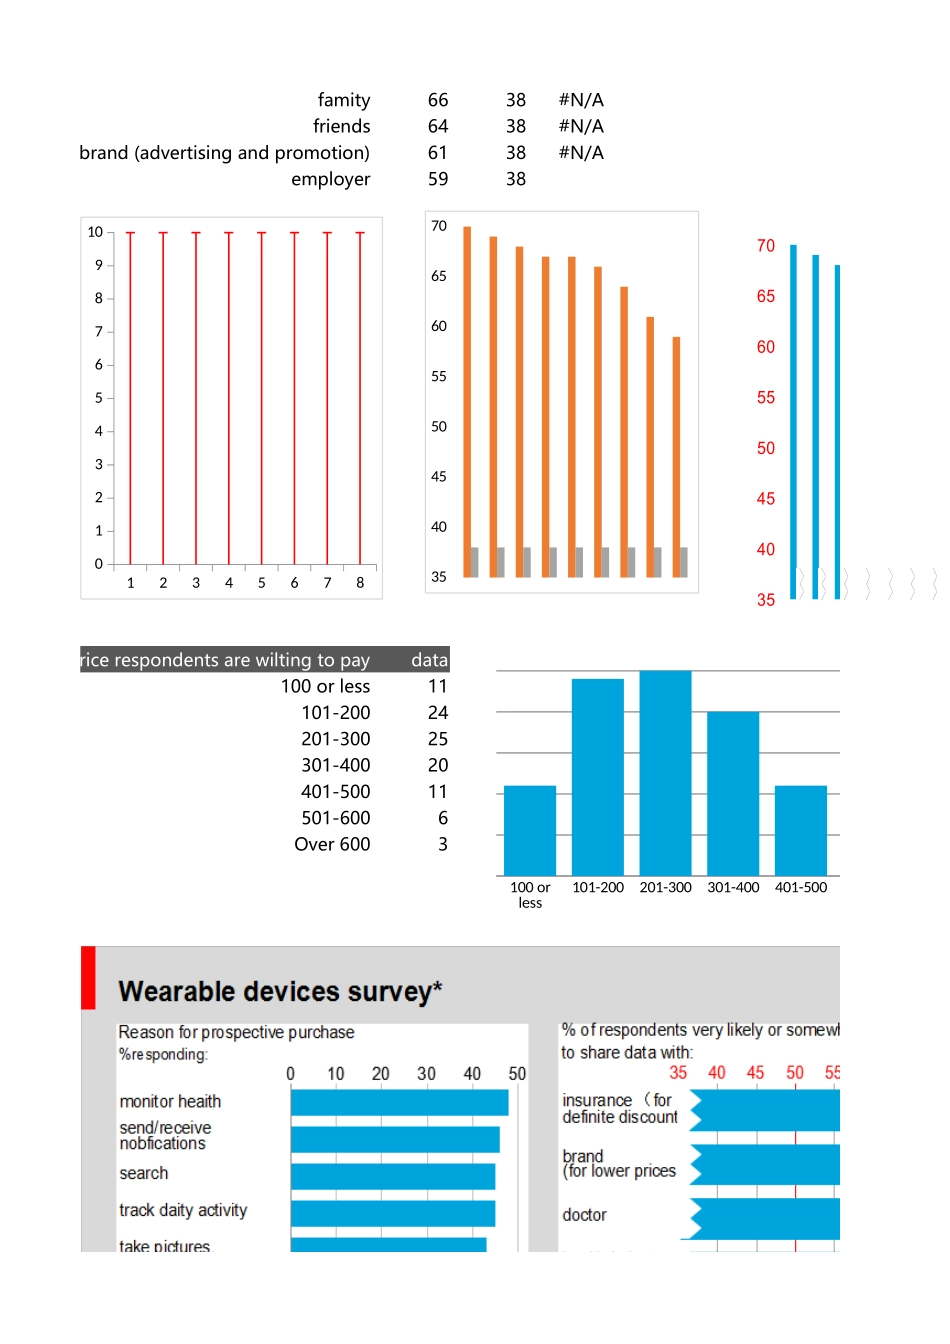
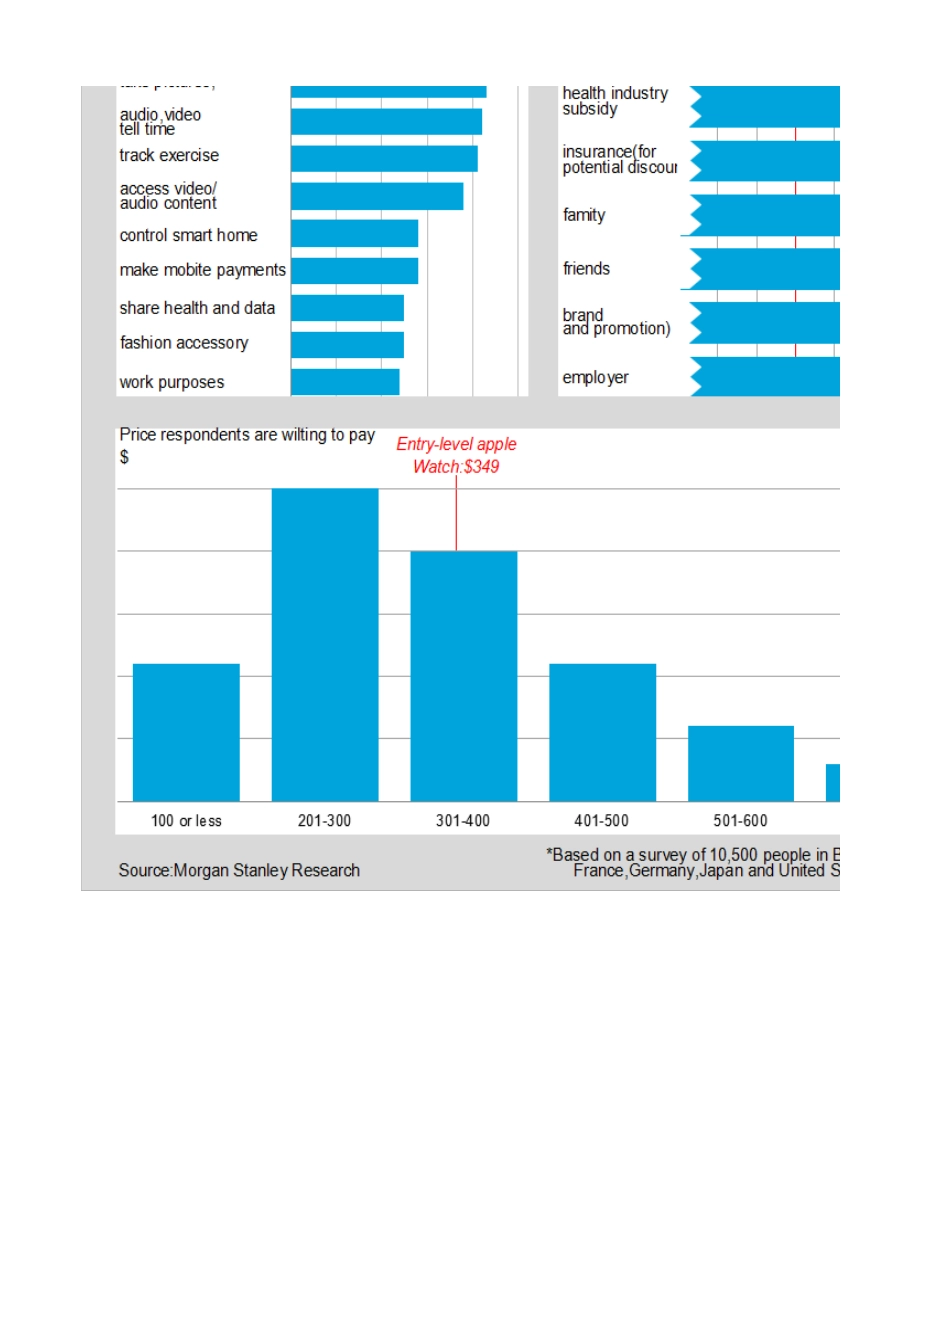
%responding:datamonitorheaith48send/receivenobfications46search45trackdaityactivity45takepictures,audio,video43telltime42trackexercise41accessvideo/audiocontent38controlsmarthome28makemobitepayments28sharehealthanddata25fashionaccessory25workpurposes24%ofrespondentsdata截断7038#N/Abrand(forlowerprices)6938#N/Adoctor6838#N/Ahealthindustrysubsidy67380insurance(forpotentialdiscount)6738#N/A误差2insurance(fordefinitediscount)010203040famity6638#N/Afriends6438#N/Abrand(advertisingandpromotion)6138#N/Aemployer5938ricerespondentsarewiltingtopaydata100orless11101-20024201-30025301-40020401-50011501-6006Over60031234567801234567891035404550556065703540455055606570100orless101-200201-300301-400401-500501-600Over60作图数据第一组数据第二组数据%responding:data%ofrespondentsmonitorheaith48send/receivenobfications46brand(forlowerprices)search45doctortrackdaityactivity45healthindustrysubsidytakepictures,audio,video43insurance(forpotentialdiscount)telltime42famitytrackexercise41friendsaccessvideo/audiocontent38brand(advertisingandpromotion)controlsmarthome28employermakemobitepayments28sharehealthanddata25fashionaccessory25workpurposes24选择第一组数据插入条形图删除图例,删除标题设置纵坐标标签为“无”刻度线为“无”,且逆序类别设置背景色为无填充无线条设置网格线为灰色第二组数据需要对其进行处理因图表网格线中有不同颜色突出使用柱形图制作散点图删除图例,删除标题insurance(fordefinitediscount)步骤1调整系类无间距为“40”设置刻度值最小为0,最大为50,间距为10,线条为“无”设置系列为RGB值为0,163,219步骤2方法1选择误差2的数据插入柱形图01020304050选中柱形图添加误差线设置横坐标轴在刻度线上选择数据与截断数据黏贴到图表中,选择新系列把新系列改成条形图把主纵坐标与横坐标设置不可见调出次要纵坐标设置次要纵坐标为逆序刻度,横坐标轴交叉为“自动”,分列不显示,线条设置为白色,线粗比网格调出次要纵网格线画出截断图形,填充白色,复制图形后选择截断数据黏贴设置系列颜色设置背景无填充网格线灰色选择第三组数据插入柱形图选中横坐标设置纵坐标交叉位置为“最大分类”,主要刻度线为“无”设置网格线为灰色设置背景无颜色对三个...